Frequently Asked Questions
What is the UESI?
The Urban Environment and Social Inclusion Index (UESI) leverages large-scale datasets with detailed resolution to provide an unprecedented view of how cities around the world are — or are not — meeting global goals for sustainable and inclusive urban growth.
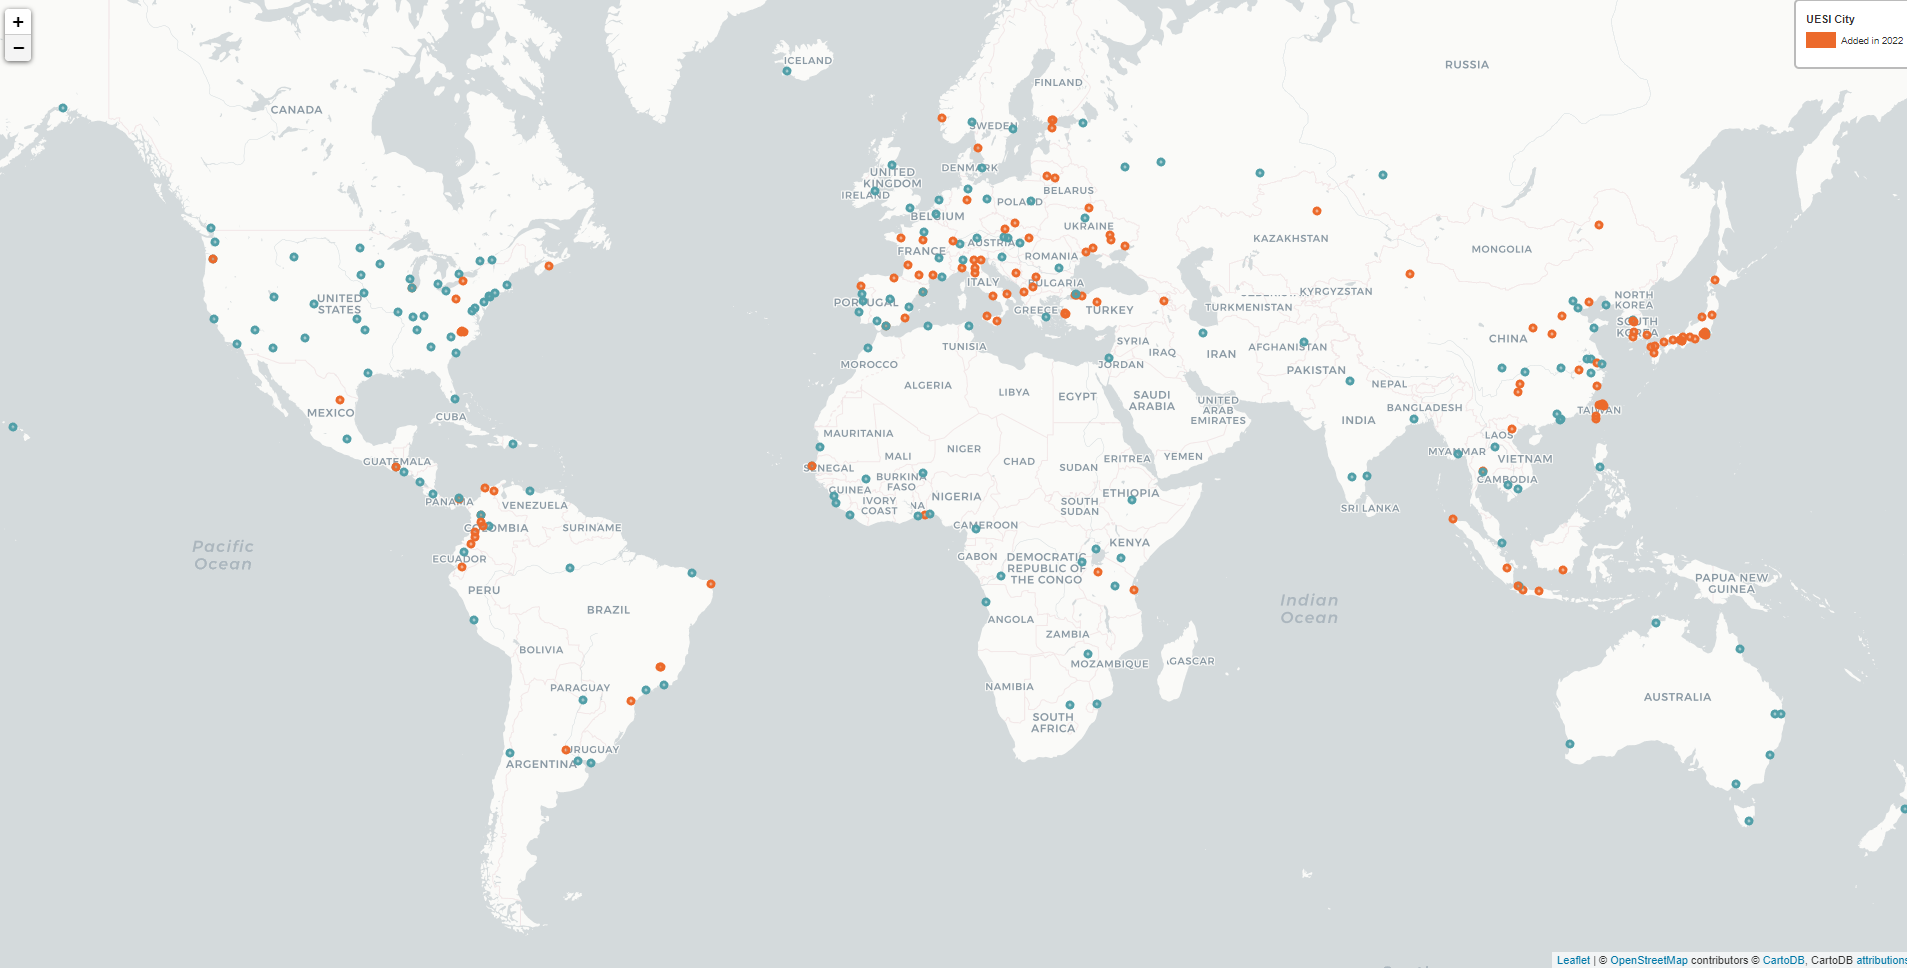
Currently it includes nearly 300 cities and assesses neighborhood-level access to environmental benefits – like public transit and green space – and environmental burdens, such as air pollution and urban heat island, along with city-wide indicators like water stress. In addition to these environmental indicators, the UESI includes neighborhood-level data on population and income. Combined, these indicators help provide a sense of the environmental quality of life urban residents experience, according to where they live, work, or play.
What is the difference between the 2023 UESI and previous versions of the UESI?
The Urban Environment and Social Inclusion Index was first piloted with 32 cities, featured in a 2018 report, which can be downloaded as a PDF. In addition to the air pollution, public transit, urban heat, tree cover, and water stress indicators, the pilot UESI also included two citywide indicators, tracking climate mitigation and adaptation policy and water resources management. These data are available online for cities that were included in the pilot analysis. We also provide an analysis of the UESI pilot cities (Results for Pilot Cities), which compares how these primarily global cities perform on the UESI indicators.
In 2020 we launched the second version of the UESI which included over 160 cities, five issue areas (Air Quality, Climate Change, Water and Sanitation, Urban Ecosystem, and Transportation), and 11 indicators. The results for this version and the Policy makers summary are also available for download.
The 2023 version of the UESI includes 283 cities from almost 14,000 thousand districts, comprising cities from all continents, except Antarctica, and from multiple levels of development. The framework remains similar, but for this version we have leveraged the computational power of Google Earth Engine and multiple open source data like Open Street Maps to include cities throughout the globe. In addition we are constantly evaluating new datasets to expand and update the proposed indicators in areas like Climate Change.
.

Categories of environmental issues and indicators assessed in the 2018 pilot version of the Urban Environment and Social Inclusion Index (UESI).
What is the UESI portal and how can I use it?
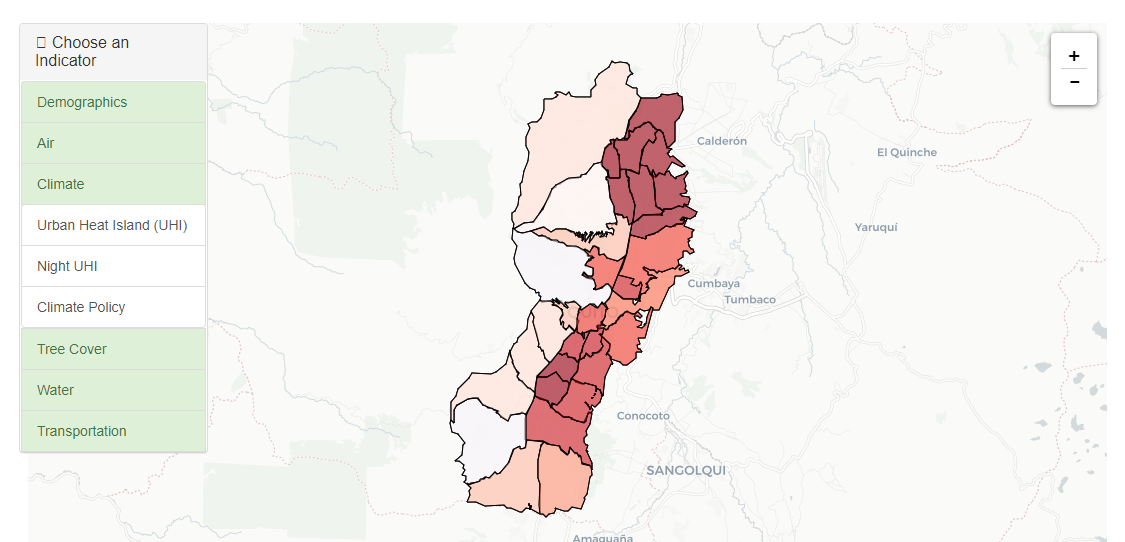
The UESI portal visualizes and compares the UESI results at the neighborhood level. To get started using the portal, select the region and the city you wish to explore to get a summary of the UESI results, an interactive map of the city’s neighborhoods and a rose chart presenting the results of the highlighted neighborhood.
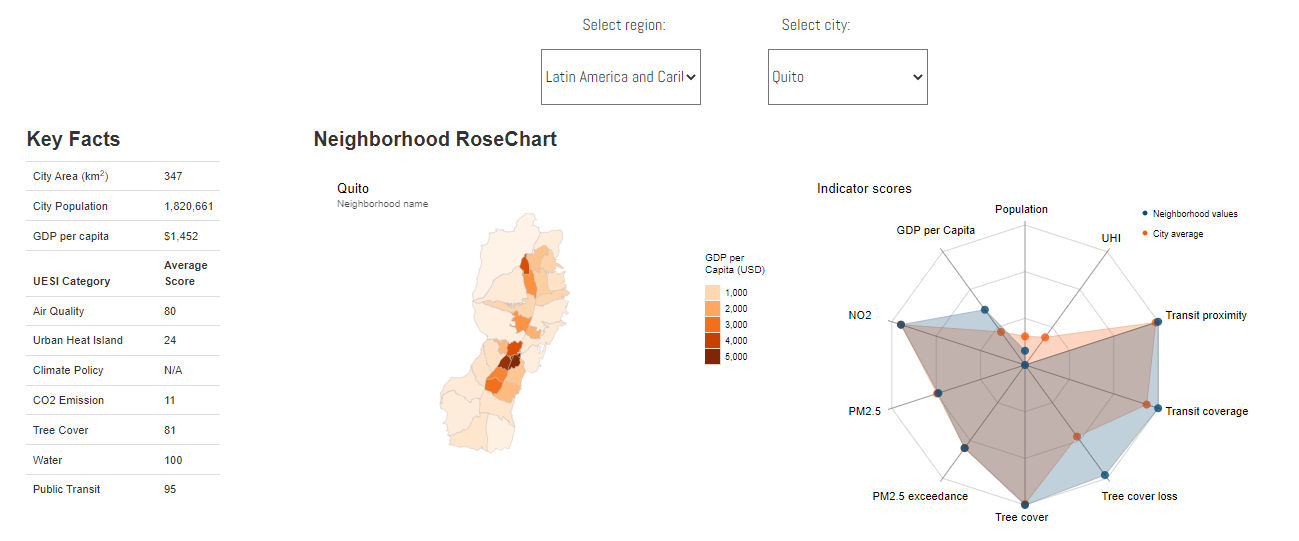
The page also provides an interactive Quadrant Plot and Equity Curves to understand how equitable is the distribution of environmental benefits and hazards throughout the city (See Issue Profile on Equity for more details), and an interactive data explorer that present the base information for each city and neighborhood including the socioeconomic data.
How is the UESI different from other urban indices?
Many existing indices provide a detailed overview of a specific city, region, or indicator, or compare cities at a scale that aggregates the performance of the entire urban area. The UESI provides a novel, spatially-explicit tool that uses globally comparable datasets at a neighborhood scale, to make it possible to explore how city residents’ lived experiences may vary widely within the same city.
Why isn’t my city included in the UESI?
The UESI includes more than 283 global cities, across a range of development contexts and geographies. It spans cities from developed, emerging and developing economies, and from geographies all around the world.
The main limiting factor in including cities in the UESI is access to data – particularly to official neighborhood-level socioeconomic and income data, and spatial data demarcating the administrative boundaries that define a city and its neighborhoods. We hope to expand the list of UESI cities, to continue building our representation of small and medium-sized urban areas, and to deepen the representation of cities from many different geographic contexts (see the “How can my city participate?” question on this FAQ page for more details on how to work with the UESI to add your city to its roster).
How can my city participate in the UESI?
We are constantly looking to add additional cities to the Urban Environment and Social Inclusion Index. Do you work in city government, or have access to data for your city? Get in touch with our team through this online form.
Can I access the UESI’s data?
All of the data informing the UESI is available through the online website. You can download data by neighborhood and city in an Excel spreadsheet from our Downloads page. Please contact our team through this online form if you have specific questions about accessing a dataset.
Can I use the UESI’s materials and graphics in my presentation, class, or paper?
The UESI’s materials are available under a Creative Commons License: Attribution-NonCommercial 4.0 International (CC BY-NC 4.0).

The suggested citation for any use of the 2018 UESI report on pilot cities is: Hsu, A., N. Alexandre, J. Brandt, T. Chakraborty, S. Comess, A. Feierman, T. Huang, S. Janaskie, D. Manya, M. Moroney, N. Moyo, R. Rauber, G. Sherriff, R. Thomas, J. Tong, Y. Xie, A. Weinfurter, Z. Yeo (in alpha order), et al, (2018). The Urban Environment and Social Inclusion Index. New Haven, CT: Yale University. Available: datadrivenyale.edu/urban.
The suggested citation for any materials from the UESI website is: Data-Driven EnviroLab. (2020). The Urban Environment and Social Inclusion Index. Singapore: Yale-NUS College. Available: datadrivenlab.org/urban.
Why aren’t race, gender, and other types of demographic data used to understand how equitably environmental benefits and burdens are distributed within cities?
Socioeconomic status is not the only determinant of vulnerability. Many other variables, such as education levels, minority/ethnicity statuses, or age compositions, can highlight cumulative social vulnerabilities and intersectionalities. However, data on these variables at the desired neighborhood scale is only available and complete for a few cities. Additionally, systems of advantage, disadvantage and oppression often manifest differently depending on the context. Race, for instance, plays a powerful role in environmental equity in U.S. contexts, but may be less salient in other countries. Balancing data quality, availability and coverage, the UESI focuses primarily on understanding how urban residents with varying income levels may be affected by environmental conditions. However, it is important to note that relying solely on income as a way of understanding equity may miss several aspects of people’s lived experiences and thus risk developing incomplete policy solutions.
The Equity and Social Inclusion Issue Profile, and particularly Box 2, Bringing an intersectional analysis to the UESI, include a more detailed discussion of the UESI’s approach to assessing equity.
Can you tell me more about the Data-Driven EnviroLab (Data-Driven Lab)?
The Data-Driven EnviroLab (Data-Driven Lab) is an interdisciplinary and international group of researchers, scientists, programmers, and visual designers based at the University of North Carolina Chapel Hill and is a joint initiative between the Department of Public Policy , the Environment, Ecology, and Energy (E3P) Program, and the Institute for Environment at UNC. The Data-Driven Lab uses innovative data analytics to distill signals from large-scale and unconventional datasets and develop policy solutions to contemporary environmental problems. Working with scholars and policymakers across the globe, the Data-Driven Lab strives to strengthen environmental policy at all levels. We promote evidence-based approaches to problem solving while boosting information disclosure and transparency among public institutions, private companies, civic organizations and individual citizens.
How should I cite the UESI?
The suggested citation for any use of the 2018 UESI report is: Hsu, A., N. Alexandre, J. Brandt, T. Chakraborty, S. Comess, A. Feierman, T. Huang, S. Janaskie, D. Manya, M. Moroney, N. Moyo, R. Rauber, G. Sherriff, R. Thomas, J. Tong, Y. Xie, A. Weinfurter, Z. Yeo (in alpha order), et al. (2018). The Urban Environment and Social Inclusion Index. New Haven, CT: Yale University. Available: datadrivenlab.org/urban.
The suggested citation for any materials from the UESI website is: Data-Driven EnviroLab. (2020). The Urban Environment and Social Inclusion Index. Singapore: Yale-NUS College. Available: datadrivenlab.org/urban.