Issue Profile
Water
Global urban water demand and wastewater production are surging, creating urgent management challenges for cities.
Chapter Authors
Amy Weinfurter
The water resource management issue category includes two indicators. Water stress measures the ratio of surface water withdrawn, relative to the total annual natural availability of surface water available, in key sub-basins of interest.Wastewater treatment measures the proportion of wastewater that is treated before it is released back into the environment, relative to the amount of wastewater generated by an urban area.
Water stress: Water stress measures a city’s vulnerability to drought, pollution, and other shocks or threats to water availability, as well as an urban area’s environmental impact on the lakes, rivers, and streams it draws water from. As urban populations grow, it will be increasingly vital for cities to use water efficiently, to prevent degrading the upstream ecosystems they rely on; ensure they can meet the needs of their growing populations and economies; and reduce conflicts between competing water needs from agriculture, industry, and other communities.
Wastewater Treatment: Wastewater includes any water degraded by anthropogenic influences. It is often a mix of domestic gray water, discharged from home sinks, baths, or washing machines; blackwater, such as water discharged from toilets; and industrial wastewater, which often carries chemical contaminants. Wastewater can also include surface water and stormwater runoff, which occurs when rain gathers pollutants and speed as it travels over a city’s sidewalks, roads, and other surfaces.
Left untreated, wastewaters’ nutrient and chemical loads can disrupt natural water systems, triggering algal blooms, impacting aquatic life, and endangering aquatic ecosystems.1Connor, R., Renata, A., Ortigara, C., Koncagül, E., Uhlenbrook, S., Lamizana-Diallo, B. M., … & Hendry, S. (2017). The United Nations World Water Development Report 2017. Wastewater: The Untapped Resource. The United Nations World Water Development Report. Retrieved from: http://unesdoc.unesco.org/images/0024/002475/247553e.pdf. Untreated wastewater endangers human health, putting critical drinking water supply systems at risk, and leaving residents vulnerable to exposure to waterborne diseases, heavy metals and pesticides, or illness from consuming contaminated fish or freshwater organisms.2Hsu, A. et al. (2016). 2016 Environmental Performance Index. New Haven, CT: Yale University. Available: www.epi.yale.edu. It also takes a financial toll, by increasing health care costs and threatening economic activities that use water, such as industrial production, fisheries, aquaculture and tourism.3United Nations Environment Programme (UNEP). (2015). Economic Valuation of Wastewater – The Cost of Action and the Cost of No Action. UNEP: Nairobi, Kenya. Retrieved from: unep.org/gpa/Documents/GWI/Wastewater%20Evaluation%20Report%20Mail.pdf.
The Nature Conservancy’s Urban Water Blueprint project4McDonald, R.I. and D. Shemie. (2014). Urban Water Blueprint: Mapping conservation solutions to the global water challenge. The Nature Conservancy: Washington, D.C. provides the water stress data. Wastewater treatment data comes from a combination of sources, including the Food and Agriculture Organization of the United Nations’ (FAO) Aquastat database of national municipal wastewater treatment data, city and utility reports, and academic literature. Please see the Metadata for detailed accounting of data sources.
The water stress indicator target is a ratio of annual surface freshwater water withdrawal, relative to annual surface freshwater availability, below 0.4:
annual freshwater withdrawal/annual surface freshwater availability> 0.4
The wastewater treatment indicator target is 100 percent treatment of the wastewater generated by a city.
Description
The Growth in Global Water Demand
Urban water resource management faces a critical juncture. The 100 largest global cities occupy less than 1 percent of the earth’s land area. However, their drinking water source watersheds span 1.7 billion hectares, roughly 12 percent of global land area, and provide water to nearly one billion people.5McDonald, R.I. and D. Shemie. (2014). Urban Water Blueprint: Mapping conservation solutions to the global water challenge. The Nature Conservancy: Washington, D.C. Cities’ water management strategies will have outsize repercussions for their residents’ water security and for the health of the world’s watersheds.6McDonald, R.I. and D. Shemie. (2014). Urban Water Blueprint: Mapping conservation solutions to the global water challenge. The Nature Conservancy: Washington, D.C.
Rapidly growing urban populations, and the stress of a changing climate, have already led to mounting pressure on the world’s watersheds. The World Economic Forum’s 2014 risk report classified water security as one of the greatest threats to global prosperity. 7World Economic Forum (2014). Global Risks 2014. The World Economic Forum: Geneva, Switzerland. 8McDonald, R.I. and D. Shemie. (2014). Urban Water Blueprint: Mapping conservation solutions to the global water challenge. The Nature Conservancy: Washington, D.C. Already, municipal, industrial, and agricultural sectors compete for freshwater, especially in water-scarce areas.9Sato, T., Qadir, M., Yamamoto, S., Endo, T., & Zahoor, A. (2013). Global, regional, and country level need for data on wastewater generation, treatment, and use. Agricultural Water Management, 130, 1-13. Water demand currently exceeds water supply in regions containing over 40 percent of the world’s population,10Bennett, A. J. (2000). Environmental consequences of increasing production: some current perspectives. Agriculture, ecosystems & environment, 82(1), 89-95. with limited access to freshwater shaping lifestyles and constraining development opportunities in water scarce areas (see Box 1, Urban Access to Safe Drinking Water and Sanitation).11Qadir, M., Sharma, B. R., Bruggeman, A., Choukr-Allah, R., & Karajeh, F. (2007). Non-conventional water resources and opportunities for water augmentation to achieve food security in water scarce countries. Agricultural water management, 87(1), 2-22. By 2030, global demand for water is expected to increase by 50 percent, with most of this growth concentrated in cities;12United Nations Habitat (UN Habitat). (2016). World Cities Report 2016 – Urbanization and Development: Emerging Futures. UN-Habitat: Nairobi, Kenya. Retrieved from: wcr.unhabitat.org/main-report/. by 2050, urban water demand is expected to rise by 80 percent, as climate change alters the distribution and timing and water availability.13Flörke, M., Schneider, C., & McDonald, R. I. (2018). Water competition between cities and agriculture driven by climate change and urban growth. Nature Sustainability, 1(1), 51. One analysis of the future of nearly 500 cities by Flörke et al. (2018) found that more than 27 percent of these cities studied, containing 233 million people, will have water demands that exceed surface-water availability in 2050.14Flörke, M., Schneider, C., & McDonald, R. I. (2018). Water competition between cities and agriculture driven by climate change and urban growth. Nature Sustainability, 1(1), 51. At the same time, rapidly expanding urban populations, improved living conditions, and economic development are accelerating wastewater generation.15Lazarova, V., & Bahri, A. (Eds.). (2004). Water reuse for irrigation: agriculture, landscapes, and turf grass. CRC Press. 16Sato, T., Qadir, M., Yamamoto, S., Endo, T., & Zahoor, A. (2013). Global, regional, and country level need for data on wastewater generation, treatment, and use. Agricultural Water Management, 130, 1-13. The combined rise in the urban demand for water and the growth of municipal wastewater generation creates an urgent management challenge for cities.
Fostering improved water management is a core part of the UN’s Sustainable Development Goals (SDGs). SDG 6, which aims to ensure the availability and sustainable management of water and sanitation for all, includes targets for halving the proportion of untreated wastewater and substantially increasing safe reuse and recycling of water (Target 6.3), as well as substantially increasing water-use efficiency and ensuring sustainable withdrawals and supplies of freshwater (Target 6.4) by 2030 (UNDP, 2015). These targets are deeply intertwined. Expanding the treatment and safe reuse of water and using water more efficiently (Targets 6.3 and 6.4) would increase water available for drinking (Target 6.1) and other uses.17Connor, R., Renata, A., Ortigara, C., Koncagül, E., Uhlenbrook, S., Lamizana-Diallo, B. M., … & Hendry, S. (2017). The United Nations World Water Development Report 2017. Wastewater: The Untapped Resource. The United Nations World Water Development Report. Retrieved from: http://unesdoc.unesco.org/images/0024/002475/247553e.pdf. These accomplishments would lessen the pressure on water-related ecosystems, helping to achieve SDG target 6.6, which seeks to protect and restore these habitats by 2020. Strategic wastewater management and reuse could also help deliver other SDGs: incorporating treated wastewater into irrigation systems, for instance, could aid sustainable food production (SDG 2) while reusing wastewater by-products could create opportunities for economic development (SDG 8).18Connor, R., Renata, A., Ortigara, C., Koncagül, E., Uhlenbrook, S., Lamizana-Diallo, B. M., … & Hendry, S. (2017). The United Nations World Water Development Report 2017. Wastewater: The Untapped Resource. The United Nations World Water Development Report. Retrieved from: http://unesdoc.unesco.org/images/0024/002475/247553e.pdf.
Box 1. Urban Access to Safe Drinking Water and Sanitation
Rapidly growing urban populations, combined with the high cost of building and maintaining infrastructure, have exacerbated drinking water and sanitation challenges in urban areas. Roughly 80 percent of the world’s urban residents have access to piped drinking water, and 96 percent have access to improved drinking water sources.19World Health Organization (WHO). Unsafe drinking water, sanitation, and waste management. Retrieved from: http://www.who.int/sustainable-development/cities/health-risks/water-sanitation/en/ (accessed January 2018). However, these aggregate numbers often mask local disparities and gaps in access; informal settlements and slums, for instance, typically face lower levels of access than other areas of a city.20World Health Organization (WHO). Unsafe drinking water, sanitation, and waste management. Retrieved from: http://www.who.int/sustainable-development/cities/health-risks/water-sanitation/en/ (accessed January 2018).
Similarly, though access to improved sanitation has grown most rapidly within cities, approximately 20 percent of the urban population still lacked access to improved sanitation, and some 100 million city residents still practiced open defecation, in 2012.21World Health Organization (WHO). Unsafe drinking water, sanitation, and waste management. Retrieved from: http://www.who.int/sustainable-development/cities/health-risks/water-sanitation/en/ (accessed January 2018). Globally, just 26 percent of urban wastewater services prevent human contact along the entire course of the sanitation chain.22Connor, R., Renata, A., Ortigara, C., Koncagül, E., Uhlenbrook, S., Lamizana-Diallo, B. M., … & Hendry, S. (2017). The United Nations World Water Development Report 2017. Wastewater: The Untapped Resource. The United Nations World Water Development Report. Retrieved from: http://unesdoc.unesco.org/images/0024/002475/247553e.pdf. Access remains particularly poor in informal settlements, where high population density, combined with a dearth of physical space, infrastructure and resources, creates challenges to traditional strategies for sanitation access.23Sanergy. (n.d.). The Sanitation Crisis. Retrieved from: http://saner.gy/our-work/the-sanitation-crisis. Data that tracks access to improved drinking water and sanitation within urban areas could guide efforts to expand access, update infrastructure, or pilot new kinds of solutions. However, this information is often incomplete, inconsistent, or simply absent.
The data that does exist – collected by cities, utilities, and NGOs – suggests that access to improved water and sanitation often varies in concert with socio-economic indicators. As the maps of Sao Paulo’s household water supply and sanitation coverage illustrate, access often – though not always – varies alongside income (see Figure 1).
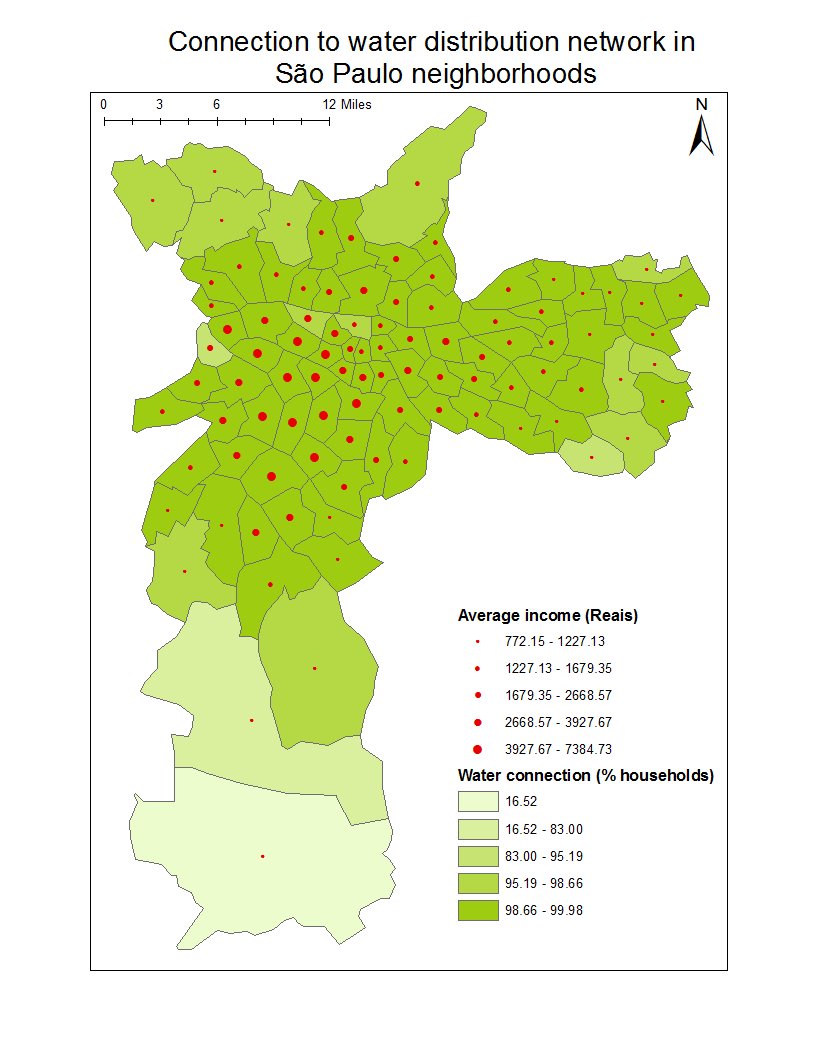
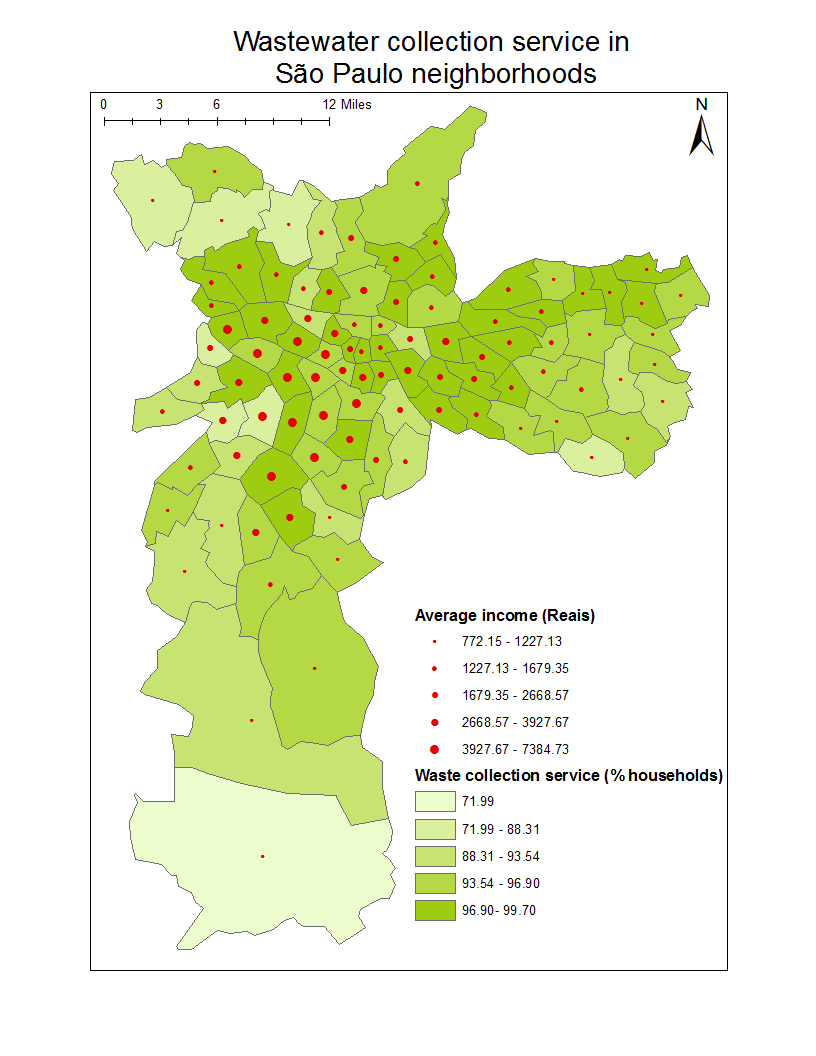
Figure 1. Maps compare the how average income levels vary alongside the lack of household water supply and sanitation varies, across neighborhoods in Sao Paulo, Brazil. Data Source: Resultados do Universo do Censo Demográfico 2010.
Additionally, for many, “improved” water is not always safe, reliable, affordable, or accessible.24Guppy, L., Anderson, K., (2017). Water Crisis Report. United Nations University Institute for Water, Environment and Health: Hamilton, Canada. Retrieved from: http://inweh.unu.edu/wp-content/uploads/2017/11/Global-Water-Crisis-The-Facts.pdf. The U.S. city of Flint, Michigan, for instance, generated headlines for dangerously high levels of lead in its drinking water supply during the summer of 2015. A survey of nearly 50,000 U.S. public water utilities revealed similar threats facing communities across the country: between 2010 and 2015, almost 19,000 public water systems had at least one instance of lead detection above 3.8 parts per billion, the level at which a formula-fed baby is at risk for elevated blood lead levels.25Environmental Working Group (EWG). (2017). Tap Water Database: State of America’s Drinking water. Retrieved from: https://www.ewg.org/tapwater/state-of-american-drinking-water.php#.WlTYUJM-cWp. Globally, more than 50 percent of urban residents in developing countries are still affected by illnesses related to insufficient access to safe drinking water and improved sanitation.26World Health Organization (WHO). Unsafe drinking water, sanitation, and waste management. Retrieved from: http://www.who.int/sustainable-development/cities/health-risks/water-sanitation/en/ (accessed January 2018).
Even when households are connected to piped sources of improved water, the availability of water can be intermittent, forcing residents to wait at home to capture water, or to purchase water from outside sources. In the words of one expert, the impact of an uncertain water supply “is a huge problem, similar to having no water at all.”27Tiwary, A. (12 July 2014). NextDrop: A startup that informs you what time water will be supplied in your area. FirstPost. Retrieved from: http://www.firstpost.com/startups-business/nextdrop-a-startup-that-informs-you-what-time-water-will-be-supplied-in-your-area-2-2010283.html. This uncertainty has particular implications for women and girls, who are often responsible for waiting at home to collect water, missing opportunities to attend school or work.28Tiwary, A. (12 July 2014). NextDrop: A startup that informs you what time water will be supplied in your area. FirstPost. Retrieved from: http://www.firstpost.com/startups-business/nextdrop-a-startup-that-informs-you-what-time-water-will-be-supplied-in-your-area-2-2010283.html. A 2007 survey by the Asian Development Bank and the Urban Development Government of India found that hours of water availability ranged from 0.75 hours (in Indore) to 12 (in Chandigarh), and averaged 4.3 hours, across 20 cities.29Ministry of Urban Development Government of India and Asian Development Bank. (2007). 2007 Benchmarking and Data Book of Water Utilities in India. Retrieved from: https://www.adb.org/sites/default/files/publication/27970/2007-indian-water-utilities-data-book.pdf. Water availability can also fluctuate widely within cities. Although the average water supply in Delhi is 157 litres per day, access varies widely across different districts. Residents in Mehrauli and Narela can expect some of the city’s lowest levels of water, of 29 and 31 litres per day, respectively, while the wealthy Cantonment district accounts for nearly 70 percent of the city’s water supply, drawing 509 litres per day.30Narain, S., & Pandey, P. (2012). Excreta Matters: How urban India is soaking up water, polluting rivers and drowning in its own waste. Centre for Science and Environment.
A number of innovative solutions are poised to help address these gaps in water and sanitation access. The NextDrop mobile app in India, for instance, connects utilities with customers and private water suppliers, notifying residents of when water will flow through their pipes, and helping utilities better understand and manage their distribution system.31Berg, N. (2014). “What Works” for Cities. Citiscope. Retrieved from: http://citiscope.org/what-works-new-cities-summit/pronita-saxena. Hyderabad’s Metropolitan Water Supply and Sewerage Board will soon adopt a similar approach, using a mobile app to help them track service reservoirs, water supply trunk mains, and their distribution network.32The Times of India. (23 October 2016). Soon, app to monitor waterworks. The Times of India. Retrieved from: https://timesofindia.indiatimes.com/city/hyderabad/Soon-app-to-monitor-water-works/articleshow/55007694.cms. Similar strategies to identify and communicate challenges in water infrastructure are poised to help utilities prioritize and address gaps in service.
Reducing Water Stress
The UESI’s water stress indicator reflects cities’ vulnerability to shocks or threats to water availability, as well as their environmental impact on the lakes, rivers, and streams it draws water from. Water stress measures the ratio of total annual surface water withdrawals, relative to the annual natural availability of surface water, in particularly important watersheds.
Adopting the approach of many recent analyses,33 McDonald, R.I. and D. Shemie. (2014). Urban Water Blueprint: Mapping conservation solutions to the global water challenge. The Nature Conservancy: Washington, D.C. 34Vörösmarty, C. J., Federer, C. A., & Schloss, A. L. (1998). Potential evaporation functions compared on US watersheds: Possible implications for global-scale water balance and terrestrial ecosystem modeling. Journal of Hydrology, 207(3-4), 147-169. we classify a city as water stressed if the ratio of annual surface freshwater withdrawal to annual surface freshwater availability is 0.4 or greater – meaning 40 percent or more of the total available surface freshwater is withdrawn. This threshold should be considered a benchmark, rather than the only or final determinant, of a city’s water stress. Cities with water stress ratios of 0.3 and 0.5, for instance, may face very similar levels of vulnerability to water shocks or shortages, despite falling on different ends of this 0.4 threshold. It will also be important for future analyses to track water stress over time, to counter the potential impact of droughts, floods, or other events that may influence a city’s score in one particular year.
Additionally, water withdrawal can begin to negatively impact aquatic ecosystems well before water scarcity becomes a threat to cities. Thresholds for the level of water withdrawal that negatively affect freshwater aquatic ecosystems vary, depending on geography, stream type, and a number of other factors. In a review of 128 river basins, Smakhtin et al. (2004) found that freshwater-dependent ecosystems required approximately 20 to 50 percent of the mean annual river flow to maintain fair conditions, and suggest that as a universal metric, at least 25 percent of a river’s flow should be left in a river or stream to support aquatic flora and fauna.35Smakhtin, V., Revenga, C., & Döll, P. (2004). A pilot global assessment of environmental water requirements and scarcity. Water International, 29(3), 307-317. In other words, withdrawal rates well below 40 percent can still threaten these freshwater ecosystems.
In addition to surface freshwater, drawn from lakes, streams, and rivers, cities often also rely on groundwater, desalinated water, or water from other sources, such as recycled water, rainwater harvesting, or private water vendors. Table 1 lists each city’s reliance on different water sources. The majority of cities (20/31) rely on surface water for at least 90 percent of their water needs, and 24 cities rely on it for the majority (at least 50 percent) of their water needs. Four cities – Beijing, Berlin, Copenhagen and Mexico City – are mostly dependent on groundwater, while Lima splits its water supply equally between surface and groundwater. While we focus the UESI indicator on surface freshwater stress, to enable consistent comparisons across cities, Table 1 also notes the results of a 2014 analysis by McDonald & Shemie (extending the analysis of Gleeson et al., 2012), assessing whether the abstraction of groundwater, relative to the rate of groundwater recharge, is greater than 1, and therefore stressed.36McDonald, R.I. and D. Shemie. (2014). Urban Water Blueprint: Mapping conservation solutions to the global water challenge. The Nature Conservancy: Washington, D.C. 37 Gleeson, T., Wada, Y., Bierkens, M. F., & van Beek, L. P. (2012). Water balance of global aquifers revealed by groundwater footprint. Nature, 488(7410), 197-200. Three of the four cities reliant on groundwater for a majority (over 50 percent) of their urban water supply – Beijing, Berlin, and Mexico City – rely on stressed groundwater resources.
| City | Source of water supply | Surface water stressed | Groundwater stressed | |||
| Ground water | Surface water | Desalinated water | Other | |||
| Amsterdam | 0% | 100% | 0% | 0% | Not stressed | NA |
| Atlanta | No data | No data | No data | No data | No data | Not stressed |
| Bangalore | No data | No data | No data | No data | No data | Not stressed |
| Bangkok | 0% | 100% | 0% | 0% | Not stressed | NA |
| Barcelona | 0% | 100% | 0% | 0% | Not stressed | NA |
| Beijing | 72% | 22% | 0% | 7% | Stressed | Stressed |
| Berlin | 100% | 0% | 0% | 0% | NA | Stressed |
| Boston | 0% | 100% | 0% | 0% | Not stressed | NA |
| Chicago | 0% | 100% | 0% | 0% | Not stressed | NA |
| Copenhagen | 100% | 0% | 0% | 0% | NA | Not stressed |
| Casablanca | 1% | 99% | 0% | 0% | Not stressed | Not stressed |
| Detroit | 0% | 100% | 0% | 0% | Not stressed | NA |
| Ho Chi Minh City | 7% | 93% | 0% | 0% | Not stressed | Not stressed |
| Jakarta | 0% | 100% | 0% | 0% | Stressed | NA |
| Johannesburg | 0% | 100% | 0% | 0% | Not stressed | NA |
| Lima | 50% | 50% | 0% | 0% | Stressed | Stressed |
| London | 41% | 59% | 0% | 0% | Not stressed | Not stressed |
| Los Angeles | 0% | 100% | 0% | 0% | Stressed | NA |
| Manila | 20% | 80% | 0% | 0% | Not stressed | Not stressed |
| Melbourne | 0% | 100% | 0% | 0% | Not stressed | NA |
| Mexico City | 81% | 19% | 0% | 0% | Not stressed | Stressed |
| Montreal | 0% | 100% | 0% | 0% | Not stressed | NA |
| New Delhi | 4% | 96% | 0% | 0% | Not stressed | Not stressed |
| New York | 0% | 100% | 0% | 0% | Not stressed | NA |
| Paris | 46% | 54% | 0% | 0% | Not stressed | Not stressed |
| São Paulo | 0% | 100% | 0% | 0% | Not stressed | NA |
| Seoul | 0% | 100% | 0% | 0% | Not stressed | NA |
| Singapore | 0% | 95% | 5% | 0% | Stressed | NA |
| Tel Aviv | 55% | 45% | 0% | 0% | Stressed | Stressed |
| Tokyo | 0% | 100% | 0% | 0% | Stressed | NA |
| Vancouver | 0% | 100% | 0% | 0% | Not stressed | NA |
Table 1. Description of UESI pilot cities’ water supply sources (percent surface freshwater, groundwater, desalinated water, or other sources). A city’s surface water use is classified as stressed if the annual ratio of surface freshwater water withdrawal, relative to surface freshwater available, is greater than 0.4. A city’s groundwater use is classified as stressed if the ratio of annual abstraction of groundwater, relative to the annual recharge of groundwater, is greater than 1. (Sources: Data on the distribution of urban water sources and surface water stress comes from The Nature Conservancy’s City Water Map (McDonald & TNC, 2016), utilizing the Water Gap Model (Alcamo et al., 2003; data for groundwater stress comes from McDonald et al. (2014)).
Increasing Wastewater Treatment
Many of the drivers behind growing water demand are also contributing to increased wastewater generation. Wastewater includes any water degraded by anthropogenic influences. Urban wastewater is often a mix of domestic gray water, discharged from home sinks, baths, or washing machines; blackwater, such as water discharged from toilets; commercial wastewater, from sources such as hospitals; and industrial effluent, which often carries chemical contaminants. Cities’ wastewater can also include surface water and stormwater runoff, which occurs when rain gathers pollutants and speed as it moves over a city’s sidewalks, roads, and other surfaces.
Untreated wastewater carries environmental, economic, and human health risks. High levels of nutrients can trigger algal blooms, eutrophication and dead zones; contaminants and increased water temperatures can also endanger aquatic ecosystems and biodiversity. Uncollected or untreated wastewater can increase the burden of disease by degrading drinking and bathing water sources. People also face exposure to pathogens through the consumption of food irrigated by untreated wastewater, or from working or playing in close proximity to untreated wastewater.
Untreated wastewater also takes a financial toll, through increased health care costs and impacts on economic activities that use water, such as industrial production, fisheries, aquaculture and tourism. Exposure to wastewater can even limit the ability to export certain goods, due to restrictions on contaminated products. Conversely, successful wastewater treatment can enable cities to profit from the reuse of wastewater, as a source of water, energy, fertilizer, and other industrially valuable materials.
The UESI’s wastewater treatment metric measures the ratio of treated wastewater relative to the total amount of wastewater generated by the city. This indicator reflects both the coverage of sewerage systems – that is, the ability of the city to collect wastewater – as well as the city’s ability to treat it. Collection systems typically take the form of either off-site systems, where waste is transported through a sewage network to a treatment plant or disposal point, or on-site systems, where waste accumulates in a pit or septic tank. 38 Connor, R., Renata, A., Ortigara, C., Koncagül, E., Uhlenbrook, S., Lamizana-Diallo, B. M., … & Hendry, S. (2017). The United Nations World Water Development Report 2017. Wastewater: The Untapped Resource. The United Nations World Water Development Report. Retrieved from: http://unesdoc.unesco.org/images/0024/002475/247553e.pdf.
While urban systems typically employ off-site systems, septic tanks remain a prevalent strategy in many cities. Eight-five percent of Manila’s population and 64 percent of Jakarta’s population rely on septic systems. 39 Claudio, L.E. (2015). Wastewater Management in the Philippines. Environmental Management Bureau Region 3. Retrieved from: http://www.wipo.int/edocs/mdocs/mdocs/en/wipo_ip_mnl_15/wipo_ip_mnl_15_t4.pdf. 40 Japan International Cooperation Agency (JICA). (2012). The Project for Capacity Development of Wastewater Sector Through Reviewing the Wastewater Management Master Plan in DKI Jakarta in the Republic of Indonesia. Retrieved from: http://open_jicareport.jica.go.jp/pdf/12078622_01.pdf. More than 3,000 houseboats parked along Amsterdam’s canals also rely on on-site sanitation, much of which bypassed the city’s treatment system until recently.41 DutchAmsterdam. (May 2015). “Many Amsterdam houseboats connected to sewer system; many not yet.” Retrieved from: http://www.dutchamsterdam.nl/564-houseboats-amsterdam. The treatment options for on-site systems vary: they can be periodically emptied, and then transported to sites for additional treatment and/or disposal. Some are linked to small-scale sewerage systems that convey wastewater to nearby treatment plants. Still others are treated through leaching beds that filter and partially treat water as its absorbed into the ground.42Connor, R., Renata, A., Ortigara, C., Koncagül, E., Uhlenbrook, S., Lamizana-Diallo, B. M., … & Hendry, S. (2017). The United Nations World Water Development Report 2017. Wastewater: The Untapped Resource. The United Nations World Water Development Report. Retrieved from: http://unesdoc.unesco.org/images/0024/002475/247553e.pdf.
Old or overstressed on-site systems can become significant sources of pollution.43Connor, R., Renata, A., Ortigara, C., Koncagül, E., Uhlenbrook, S., Lamizana-Diallo, B. M., … & Hendry, S. (2017). The United Nations World Water Development Report 2017. Wastewater: The Untapped Resource. The United Nations World Water Development Report. Retrieved from: http://unesdoc.unesco.org/images/0024/002475/247553e.pdf. In many cases, however, large volumes of wastewater captured by an on-site sewerage system may also be untreated, as water is lost through broken or leaking pipes; discharged before being treated when a sewage network is overwhelmed with rainwater; or captured for illegal reuse by residents along the network44Connor, R., Renata, A., Ortigara, C., Koncagül, E., Uhlenbrook, S., Lamizana-Diallo, B. M., … & Hendry, S. (2017). The United Nations World Water Development Report 2017. Wastewater: The Untapped Resource. The United Nations World Water Development Report. Retrieved from: http://unesdoc.unesco.org/images/0024/002475/247553e.pdf. (see Box 2, The Challenges of Modernizing Urban Sewer Systems).
Once collected, a mix of physical, chemical and biological processes are combined to reach different levels of wastewater treatment.45Connor, R., Renata, A., Ortigara, C., Koncagül, E., Uhlenbrook, S., Lamizana-Diallo, B. M., … & Hendry, S. (2017). The United Nations World Water Development Report 2017. Wastewater: The Untapped Resource. The United Nations World Water Development Report. Retrieved from: http://unesdoc.unesco.org/images/0024/002475/247553e.pdf. Primary treatment involves the screening and filtration of suspended solid waste, which reduces wastewater’s biochemical oxygen demand; secondary treatment breaks down the dissolved organic matter remaining after primary treatment; and tertiary treatment includes any additional purification processes.46Malik, O. A., Hsu, A., Johnson, L. A., & de Sherbinin, A. (2015). A global indicator of wastewater treatment to inform the Sustainable Development Goals (SDGs). Environmental Science and Policy, 48, 172-185.
Despite the benefits of wastewater treatment, an estimated 80 percent of the world’s wastewater is returned to the environment without adequate treatment.47World Water Assessment Program (WWAP). (2012). The United Nations World Water Development Report 2012: Managing Water Under Uncertainty and Risk. Paris, United Nations Educational, Scientific and Cultural Organization (UNESCO). 48United Nations Water (UN-Water). (2015). Wastewater Management: A UN-Water Analytical Brief. UN-Water. Retrieved from: www.unwater.org/ fileadmin/user_upload/unwater_new/docs/UN-Water_Analytical_Brief_Wastewater_Management.pdf 49Connor, R., Renata, A., Ortigara, C., Koncagül, E., Uhlenbrook, S., Lamizana-Diallo, B. M., … & Hendry, S. (2017). The United Nations World Water Development Report 2017. Wastewater: The Untapped Resource. The United Nations World Water Development Report. Retrieved from: http://unesdoc.unesco.org/images/0024/002475/247553e.pdf. On average, high-income countries treat approximately 70 percent of the wastewater they generate; middle-income countries treat around 38 percent; lower middle-income countries treat 28 percent; and low-income countries treat just 8 percent.50Sato, T., Qadir, M., Yamamoto, S., Endo, T., & Zahoor, A. (2013). Global, regional, and country level need for data on wastewater generation, treatment, and use. Agricultural Water Management, 130, 1-13. Within cities, wastewater collection systems often bypass informal settlements, leaving these residents especially vulnerable to the health risks of untreated wastewater.51Connor, R., Renata, A., Ortigara, C., Koncagül, E., Uhlenbrook, S., Lamizana-Diallo, B. M., … & Hendry, S. (2017). The United Nations World Water Development Report 2017. Wastewater: The Untapped Resource. The United Nations World Water Development Report. Retrieved from: http://unesdoc.unesco.org/images/0024/002475/247553e.pdf.
Data tracking cities’ performance in collecting and treating wastewater – from their sewerage networks, from on-site sanitation systems, and from informal settlements – would be invaluable in helping city managers strengthen their performance. Unfortunately, like national-level wastewater treatment data,52Malik, O. A., Hsu, A., Johnson, L. A., & de Sherbinin, A. (2015). A global indicator of wastewater treatment to inform the Sustainable Development Goals (SDGs). Environmental Science and Policy, 48, 172-185. 53Sato, T., Qadir, M., Yamamoto, S., Endo, T., & Zahoor, A. (2013). Global, regional, and country level need for data on wastewater generation, treatment, and use. Agricultural Water Management, 130, 1-13. city-level data on wastewater remains sparse and heterogeneous. We used a data ladder to combine information from different sources, using city-specific data whenever possible, but often turning to FAO’s Aquastat dataset, which provides national urban wastewater statistics, when this information was not available. As the pressure on wastewater systems grows, filling these data gaps – with city-specific information on the generation, collection, and treatment of wastewater; the level and performance of wastewater treatment; and the rates and types of wastewater reuse – would aid cities in developing, modernizing, and expanding their approach to wastewater management. Box 3, The Black and Smelly Waters Program: Citizen-Generated Environmental Transparency in China, explores some strategies cities are using to begin to fill these data gaps.
Box 2. The Challenges of Modernizing Urban Sewer Systems
They been called “the largest category of our Nation’s wastewater infrastructure that still need to be addressed”54Evans, M.E. (17 September 2015). “Flushing the toilet has never been riskier.” The Atlantic. Retreived from: https://www.theatlantic.com/technology/archive/2015/09/americas-sewage-crisis-public-health/405541/. – for many US cities, combined sewer overflows (CSOs) and sanitary system overflows (SSOs) pose a persistent water management challenge. Typically built before the advent of flush toilets, combined sewer systems (CSS) collect rainwater runoff, domestic sewage, and industrial wastewater into a single pipe or sewer system. During normal conditions, all of the collected water arrives at a wastewater treatment plant, where it is treated before being released back into the environment. However, snowmelt or rain can increase the volume of wastewater beyond the capacity of the CSS or treatment plant, and the mix of stormwater and wastewater is discharged directly into nearby water bodies55 United States Environmental Protection Agency (US EPA). (n.d.). Combined Sewer Overflows (CSOs). Retrieved from: https://www.epa.gov/npdes/combined-sewer-overflows-csos (accessed March 2018). (see Figure 2). Sanitary sewer systems are not designed to collect large volumes of stormwater, and primarily transport domestic, commercial, and industrial wastewater to treatment facilities. Sanitary sewer overflows occur when a blockage, power failure, line break or improper sewer design causes a release, often into homes or properties, as well as into nearby waterways.56United States Environmental Protection Agency (US EPA). (n.d.). Sanitary Sewer Overflows (SSOs). Retrieved from: https://www.epa.gov/npdes/sanitary-sewer-overflows-ssos (accessed March 2018).
Approximately 860 municipalities across 31 states and the District of Columbia have CSSs,57United States Environmental Protection Agency (US EPA). United States Environmental Protection Agency (US EPA). (n.d.). Combined Sewer Overflows (CSOs). Retrieved from: https://www.epa.gov/npdes/combined-sewer-overflows-csos (accessed March 2018). 58Evans, M.E. (17 September 2015). “Flushing the toilet has never been riskier.” The Atlantic. Retrieved from: https://www.theatlantic.com/technology/archive/2015/09/americas-sewage-crisis-public-health/405541/. and about 15 percent of the US population lives in communities with CSSs (many cities have both combined and separate systems).59European Commission. (2016). Assessment of impact of storm water overflows from combined waste water collecting systems on water bodies in the 28 EU Member States. Retrieved from: https://circabc.europa.eu/sd/a/c57243c9-adeb-40ce-b9db…/Final%20Report. As more and more urban citizens rely on aging infrastructure designed for smaller populations, and as old pipes build up debris that narrow them further, some cities experience overflows with less than a quarter-inch of rain.60Evans, M.E. (17 September 2015). “Flushing the toilet has never been riskier.” The Atlantic. Retrieved from: https://www.theatlantic.com/technology/archive/2015/09/americas-sewage-crisis-public-health/405541/. At least 23,000 – 75,000 SSOs, not including sewage backups into buildings, occur annually across the country.61United States Environmental Protection Agency (US EPA). (n.d.). Sanitary Sewer Overflows (SSOs). Retrieved from: https://www.epa.gov/npdes/sanitary-sewer-overflows-ssos (accessed March 2018). In total, the US sewage system releases between 3 to 10 billion gallons of untreated waste into water bodies each year, with severe implications for public safety and health.62Evans, M.E. (17 September 2015). “Flushing the toilet has never been riskier.” The Atlantic. Retrieved from: https://www.theatlantic.com/technology/archive/2015/09/americas-sewage-crisis-public-health/405541/.

Figure 2. Illustration of a combined sewer overflow system. Image: US EPA.
Overflow events wash contaminants including microbial pathogens, suspended solids, chemicals, trash, and nutrients that deplete dissolved oxygen into waterways.63Tibbetts, J. (2005). Combined sewer systems: down, dirty, and out of date. Environmental Health Perspectives, 113(7), A464. Microbial pathogens and toxins from CSOs can reach levels that pose risks to human health, and contaminate drinking water supplies, beaches and shellfish beds.64 Tibbetts, J. (2005). Combined sewer systems: down, dirty, and out of date. Environmental Health Perspectives, 113(7), A464. In New York City, for instance, combined sewers form the single largest source of pathogens to the New York Harbor system.65New York City Department of Environmental Protection. (2005). 2005 New York Harbor Water Quality Report. Retrieved from: http://www.nyc.gov/html/dep/pdf/hwqs2005.pdf. Emergency room visits for gastrointestinal distress increase after a heavy rain,66Drayna, P., McLellan, S. L., Simpson, P., Li, S. H., & Gorelick, M. H. (2010). Association between rainfall and pediatric emergency department visits for acute gastrointestinal illness. Environmental health perspectives, 118(10), 1439. 67Curriero, F. C., Patz, J. A., Rose, J. B., & Lele, S. (2001). The association between extreme precipitation and waterborne disease outbreaks in the United States, 1948–1994. American journal of public health, 91(8), 1194-1199. and combined-sewer systems play an important factor in this rise in illnesses after rain events.68Tibbetts, J. (2005). Combined sewer systems: down, dirty, and out of date. Environmental Health Perspectives, 113(7), A464.69Jagai, J. S., Li, Q., Wang, S., Messier, K. P., Wade, T. J., & Hilborn, E. D. (2015). Extreme precipitation and emergency room visits for gastrointestinal illness in areas with and without combined sewer systems: an analysis of Massachusetts data, 2003–2007. Environmental health perspectives, 123(9), 873.
The effects of these releases often travel far downstream. Chicago’s Stickney Water Reclamation Plant is the largest single source of phosphorus in the region that drains into the Mississippi River, contributing to the Connecticut-sized dead zone that emerges in the Gulf of Mexico each summer.70Hawthorne, M. (23 June 2017). “Chicago River still teems with bacteria flushed from sewers after storms.” The Chicago Tribute. Retrieved from: http://www.chicagotribune.com/news/watchdog/ct-chicago-phosphorus-pollution-met-20160525-story.html. In 2014, a single storm led to the sewer system of Detroit, Michigan to release over 44 million gallons of raw sewage from sanitary sewers and nearly 3 billion gallons from combined sewers into Lake Erie.71Lawrence, E.D. (26 October 2014). “Sewer overflows during storm hit 10 billion gallons.” Detroit Free Press. Retrieved from: https://www.freep.com/story/news/local/michigan/2014/10/26/august-storm-dumped-billions-gallons-sewage/17907335/. Wastewater releases from Detroit and other cities contributed to algal blooms that threaten the lake’s ability to provide drinking water; in 2014, one such algal bloom prevented Toledo from accessing its drinking water supply for two days.72Evans, M.E. (17 September 2015). “Flushing the toilet has never been riskier.” The Atlantic. Retrieved from: https://www.theatlantic.com/technology/archive/2015/09/americas-sewage-crisis-public-health/405541/.
Efforts to address CSOs and SSOs range; cities can modernize and separate their stormwater and sewage systems; increase stormwater storage; and implement green infrastructure to absorb and slow the flow of rainwater. Atlanta has spent $4 billion over 10 years to separate its sewer and stormwater systems;73Bienkowski, B. (27 August 2013). Sewage Overflow Adds to Detroit’s Woes. Scientific American. Retrieved from: https://www.scientificamerican.com/article/sewage-overflow-adds-to-detroits-woes/. along with Boston and Chicago, it has also built deep storage tunnels to hold stormwater overflows until they can be treated, a solution that can cost hundreds of millions of dollars.74Tibbetts, J. (2005). Combined sewer systems: down, dirty, and out of date. Environmental Health Perspectives, 113(7), A464. While relatively prosperous communities may be able to afford to these kinds of large-scale engineering solutions, these options can be more difficult for financially distressed cities like Detroit.75Tibbetts, J. (2005). Combined sewer systems: down, dirty, and out of date. Environmental Health Perspectives, 113(7), A464. According to the EPA’s 2000 Clean Watersheds Needs Survey, it would cost about $50.6 billion to reduce the nation’s CSO volume by 85 percent over the course of 20 years. Green infrastructure solutions, such as rain gardens, permeable pavements, roof gardens, or grassy swales or ditches along roadways can replenish groundwater, slow and help filter stormwater, and lessen the impact of stormwater on a city’s water treatment system at a lower cost.76Tibbetts, J. (2005). Combined sewer systems: down, dirty, and out of date. Environmental Health Perspectives, 113(7), A464. However, fully addressing the challenge of CSO and SSOs will depend on greater investment in wastewater infrastructure.77Tibbetts, J. (2005). Combined sewer systems: down, dirty, and out of date. Environmental Health Perspectives, 113(7), A464.
Data measuring urban wastewater treatment varies widely in terms of whether it incorporates CSOs and SSOs into its metrics. For instance, the FAO Aquastat database collects information for generated produced municipal wastewater – “the annual volume of domestic, commercial and industrial effluents, and storm water runoff, generated within urban areas” – as well as for collected and treated municipal wastewater, giving insight into a city’s stormwater management as well as its treatment of domestic and industrial wastewater.78Food and Agricultural Organisation of the United Nations (UN FAO). AQUASTAT Glossary. Retrieved from: http://www.fao.org/nr/water/aquastat/wastewater/index.stm (accessed April 2018). For other sources, the definition of “water produced” is somewhat uncertain – does this refer, for instance, to wastewater produced by domestic and industrial uses, or does it also include stormwater? The variation across these definitions forms a major caveat in the UESI water treatment rankings. New York City’s data, for instance, is drawn from an OECD city survey, which defines wastewater treatment as the “percentage of wastewater produced by the city that is collected and treated to at least a basic/primary level,”79The Organisation for Economic Co-operation and Development (OECD). Water Governance for Future Cities Questionnaire. Retrieved from: http://www.oecd.org/cfe/regional-policy/water-governance-in-cities-questionnaire.pdf. while other US cities are scored according to the FAO Aquastat rankings, which explicitly incorporate stormwater. This may explain why New York City’s score is higher than those of other cities, and likely does not account for the impact of its CSOs on the local environment.
Box 3. The Black and Smelly Waters Program: Citizen-Generated Environmental Transparency in China
China has taken a bold new approach to tackling the country’s hei chou he or “black and smelly rivers.” In a dramatic shift from past policies – which have closely guarded environmental data 80Andrews, S. Q. (2008). Inconsistencies in air quality metrics:‘Blue Sky’ days and PM10 concentrations in Beijing. Environmental Research Letters, 3(3), 034009. 81Demick, B. (2011). U.S. Embassy air quality data undercut China’s own assessments. LA Times, October 29. Available: http://articles.latimes.com/2011/oct/29/world/la-fg-china-air-quality-20111030. 82Hsu, A. & W. Miao. (18 June 2014). Soil Pollution in China Still a State Secret. Scientific American. Available: https://blogs.scientificamerican.com/guest-blog/soil-pollution-in-china-still-a-state-secret-infographic. – a new program is enlisting everyday citizens to help the government discover and treat “foul and filthy” sites in urban waterways.
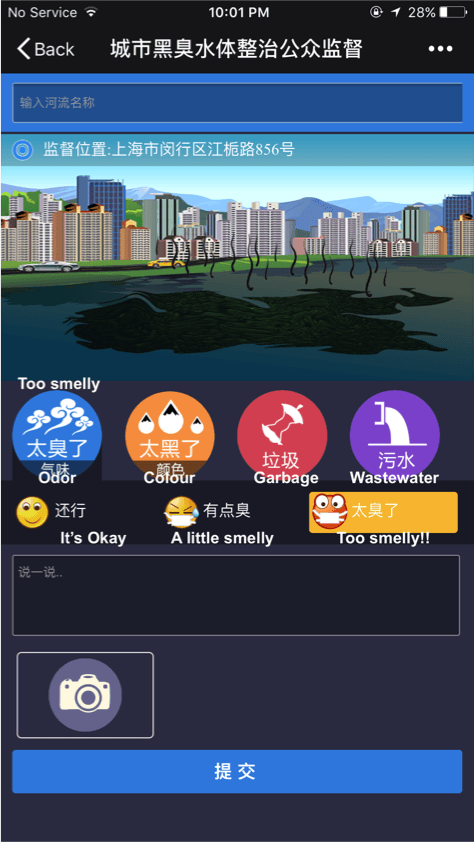
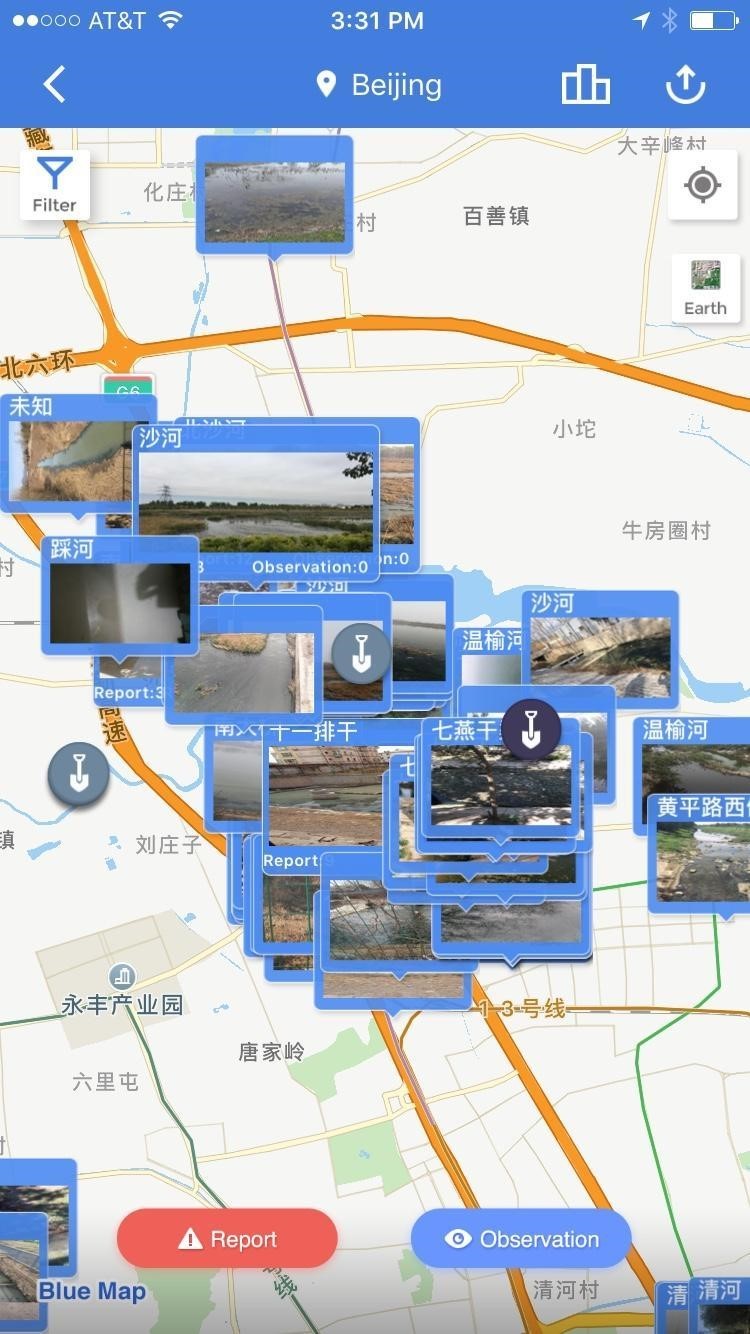
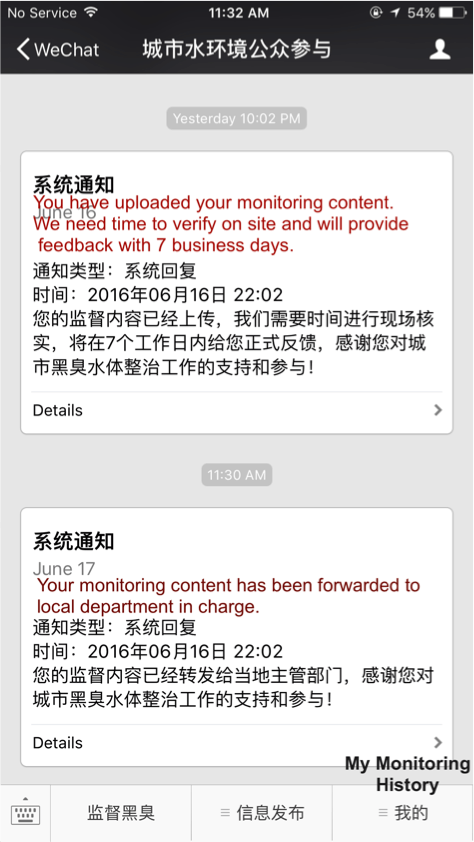
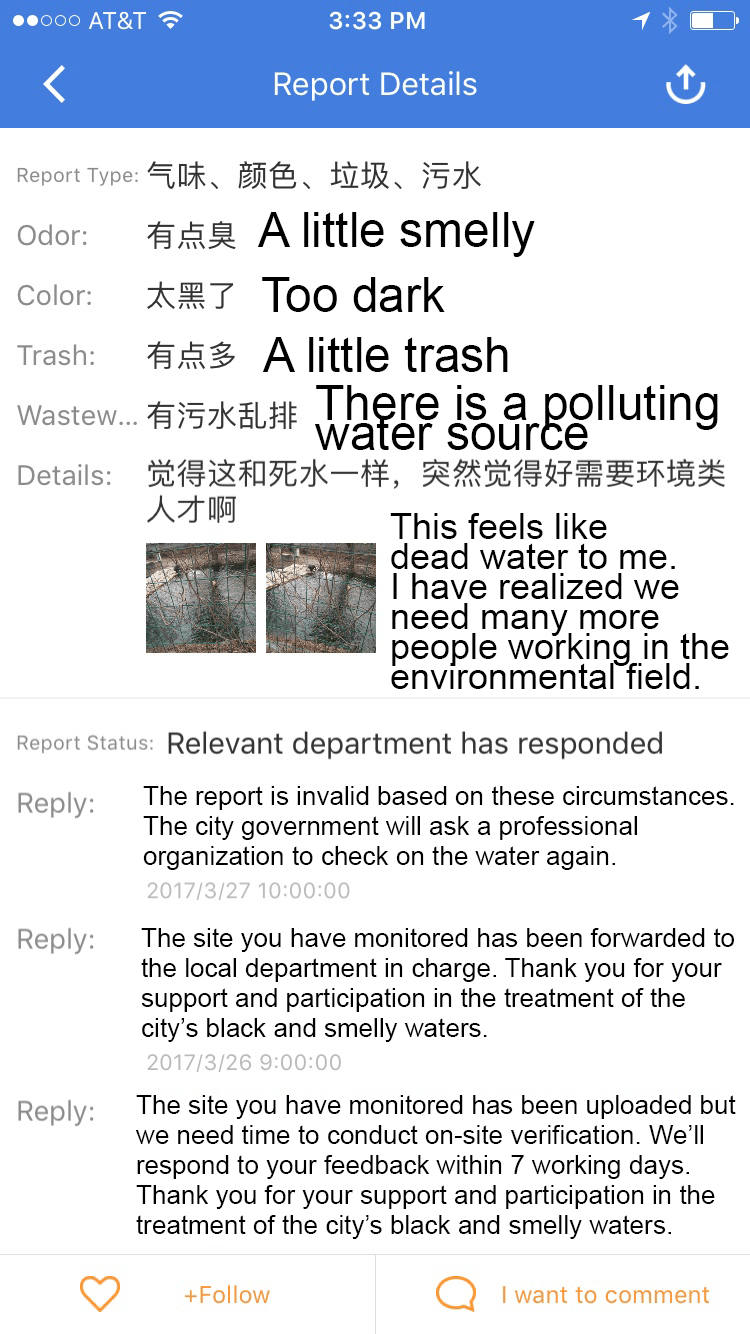
The Black and Smelly Waters program, operated by China’s Ministry of Housing & Urban-Rural Development (MOHURD) and Ministry of Ecology and the Environment (MEE), enables citizens to directly report instances of water pollution to local government agencies, who publicly respond to these reports. Using a mobile app, citizens draw on their smartphone’s geolocation services to identify an impaired or degraded water body. Participants upload a picture and description of the site, identifying any nearby sources of sewage or pollution, and rank the water body’s smell, water color, and the presence of trash. Within seven business days, the local agency responsible for the site shares a response and follow-up comments. Users can view and “follow” locations added by other participants and track the “administration progress” (zhili jinzhan) of black and smelly sites; the app notes whether a site’s treatment has yet to be remediated, is under development, is in progress, or has been completed.
Citizens access the program through WeChat, a popular messaging and social media application with more than 889 million users,83China Channel. (2017). (2017). WeChat User Behavior Report. Available: http://chinachannel.co/1017-wechat-report-users/. as well as through the website and mobile app of the Institute of Public and Environmental Affairs’ (IPE), a grassroots NGO that fosters environmental transparency. A public website, the Urban Black and Odorous Water Information Platform, combines citizen submissions with local governments’ lists of impaired waterways, creating a nationwide log of impaired urban waterways and local governments’ progress in remediating them.84Institute for Public and Environmental Affairs (IPE). (2016). Black and Smelly Rivers Survey Report I. Available: http://wwwoa.ipe.org.cn//Upload/201608230618138059.pdf.
The Black and Smelly Waters initiative is part of a sweeping nation-wide effort to improve the nation’s waterways. China’s rapid industrialization and urbanization have taken a severe toll on water quality. In 2012, one Ministry of Water Resources official estimated that 40 percent of China’s waterways were seriously polluted, and 20 percent were toxic. In an effort to reverse this trend, China’s State Council released a comprehensive, cross-sector 10-point “Action Plan for Preventing and Treatment of Water Pollution” (2015-2020; “Water Ten Plan”) in 2015. Among other goals, it aims to reduce the percentage of “foul and filthy” urban waters – water bodies that have an unpleasant color and odor, typically resulting from high levels of organic pollutants – to less than 10 percent of all urban waters by 2020, and remediate any remaining impaired urban waterways by 2030.
The Black and Smelly Waters initiative is part of a sweeping nation-wide effort to improve the nation’s waterways. China’s rapid industrialization and urbanization have taken a severe toll on water quality. In 2012, one Ministry of Water Resources official estimated that 40 percent of China’s waterways were seriously polluted, and 20 percent were toxic.85Phillips, T. (21 June 2016). “A ‘black and smelly’ job: the search for China’s most polluted rivers.” The Guardian. Available: https://www.theguardian.com/world/2016/jun/22/black-smelly-citizens-clean-chinas-polluted-rivers. In an effort to reverse this trend, China’s State Council released a comprehensive, cross-sector 10-point “Action Plan for Preventing and Treatment of Water Pollution” (2015-2020; “Water Ten Plan”) in 2015. Among other goals, it aims to reduce the percentage of “foul and filthy” urban waters – water bodies that have an unpleasant color and odor, typically resulting from high levels of organic pollutants – to less than 10 percent of all urban waters by 2020, and remediate any remaining impaired urban waterways by 2030.86Tyson, E. & Logan, K. (2016). Tracking China’s “Foul and Filthy” Rivers With Citizen Science. Wilson Center, Washington, D.C. Available: https://www.newsecuritybeat.org/2016/04/tracking-chinas-foul-filthy-rivers-citizen-science/.
By tapping into local knowledge of water pollution, the Black and Smelly Waters Program helps the government identify impaired sites – and determine whether they have been successfully remediated. Since the program’s launch in early 2016, app users have submitted an average of approximately 700 reports per quarter, and the total number of citizen-identified sites is more than double the number of sites officially designated by local government agencies.87Hsu, A., et al. Forthcoming. Black and Smelly Waters: How Citizen-Generated Transparency is Addressing Gaps in China’s Environmental Management. Journal of Environmental Policy and Planning.
Figure 1. Screenshots of the MEP/MOHURD WeChat platform, and of a local agency’s response to a black and smelly site submission.
While the app has dramatically sharpened the picture of China’s urban waterways, key gaps remain. The app is most popular – and action to restore degraded sites is most common – in large urban centers, such as Beijing, Shandong province, and Guangdong’s Pearl River Delta region.88Hsu, A., et al. Forthcoming. Black and Smelly Waters: How Citizen-Generated Transparency is Addressing Gaps in China’s Environmental Management. Journal of Environmental Policy and Planning. Few, if any, Black and Smelly reports have been made in less developed provinces with smaller urban populations, such as Xinjiang, Inner Mongolia, Qinghai, and Ningxia.
A wide range of factors might explain this geographic gap in the participation. Research has found that participation in environmental management may be influenced by citizens’ education and income; the degree of public environmental awareness, and the level of dependence on pollution sources for income.89Van Rooij, B. (2010). The people vs. pollution: understanding citizen action against pollution in China. Journal of contemporary China, 19(63), 55-77. 90 Martens 1, S. (2006). Public participation with Chinese characteristics: citizen consumers in China’s environmental management. Environmental politics, 15(02), 211-230. 91Chen X., Peterson, M.N., Hull, V., Lu, C. , Lee, G.D., Hong, D. and Lui, J. (2011). Effects of attitudinal and sociodemographic factors on pro-environmental behaviour in urban China. Environmental Conservation 38 (1): 45–52. Government agencies operating in more economically developed areas may have greater technical, financial or staff capacity to verify and respond to water quality concerns. Citizens are unlikely to report black and smelly sites, if, in the words of one villager quoted by The Guardian, “We’ve reported the situation to the environmental protection department but nobody comes.”92Phillips, T. (21 June 2016). “A ‘black and smelly’ job: the search for China’s most polluted rivers.” The Guardian. Retrieved from: https://www.theguardian.com/world/2016/jun/22/black-smelly-citizens-clean-chinas-polluted-rivers.
To help address this risk, the central government has begun to crosscheck local governments’ performance. They have also appointed local “river chiefs,” citizens who help ensure that water pollution is addressed.93Zuo, M. (20 Sept. 2017). How China’s ‘river chiefs’ are cleaning up the country’s polluted waterways. South China Morning Post. Available: http://www.scmp.com/news/china/society/article/2111824/how-cleaning-chinas-polluted-rivers-got-personal?utm_source=t.co&utm_medium=referral. The Black and Smelly Program is already a transformative approach to environmental monitoring and transparency, and an unprecedented expansion of environment transparency in China. Addressing gaps in the program’s participation and building trust in its ability to drive on-the-ground responses to pollution could expand its impact even further.
Water and Equity: Results of Pilot Cities
Water stress scores often vary alongside cities’ geographic and financial circumstances. The high levels of water stress in arid Los Angeles and tiny Singapore reflect the constraints of their geographic locations. However, some cities are better equipped than others to reach beyond their water-scare circumstances, by funding infrastructure that draws water from more distant sources. Los Angeles, New York, and Tokyo, for instance, all rely heavily on water drawn from drainage basins far outside these cities’ geographic footprints.94McDonald, R. I., Weber, K., Padowski, J., Flörke, M., Schneider, C., Green, P. A., … & Boucher, T. (2014). Water on an urban planet: Urbanization and the reach of urban water infrastructure. Global Environmental Change, 27, 96-105. Wealthy cities, in other words, can often import water, while lower-income cities often must rely on water resources in close proximity to the city. In an analysis of over 100 cities, McDonald et al. (2014) found that cities with higher GDP per capita drew on twice as much imported water than cities with lower GDP per capita.95McDonald, R. I., Weber, K., Padowski, J., Flörke, M., Schneider, C., Green, P. A., … & Boucher, T. (2014). Water on an urban planet: Urbanization and the reach of urban water infrastructure. Global Environmental Change, 27, 96-105. Figure 3 illustrates UESI cities’ levels of water stress relative to their GDP. Since the McDonald et al. (2014) study and the UESI focus mainly on large cities, this relationship may not apply to small or medium-sized cities.
However, the strategy of relying on interbasin transfers may be nearing its limits. Los Angeles, facing regional competition for dwindling and increasingly unpredictable water resources, has moved to foster greater water efficiency.96 Los Angeles County Department of Public Works. (2017). Building Water Resilience in Los Angeles County: A Report. Retrieved from: http://dpw.lacounty.gov/wrp/docs/WRP_TechDraft_Final_171103.pdf. Singapore, wary of its dependence on water imported from Malaysia, has installed some 320 sensors to detect leaks in its water supply pipeline, cutting its total water loss from leaks to less than 5 percent a year.97Lim, V. (4 September 2017). More sensors to be installed in pipes to reduce water loss. Channel NewsAsia. Retrieved from: https://www.channelnewsasia.com/news/singapore/more-sensors-to-be-installed-in-pipes-to-reduce-water-loss-9181986. 98Cheow, S. (13 November 2017). Water Loss in Singapore Comparatively Low. Straight Times. Retreived from: http://www.straitstimes.com/singapore/water-loss-in-singapore-comparatively-low. Cities like New York have worked to proactively protect or purchase their water sources, while other cities, such as Jakarta, are looking at strategies to restore the degraded ecosystems they rely on, to help recharge aquifers and filter water.99Hamzah, H. (31 July 2017). “Without Forests, Jakarta’s Water Situation Worsens.” World Resources Institute: Washington, D.C. Retrieved from: http://www.wri.org/blog/2017/07/without-forests-jakartas-water-situation-worsens.
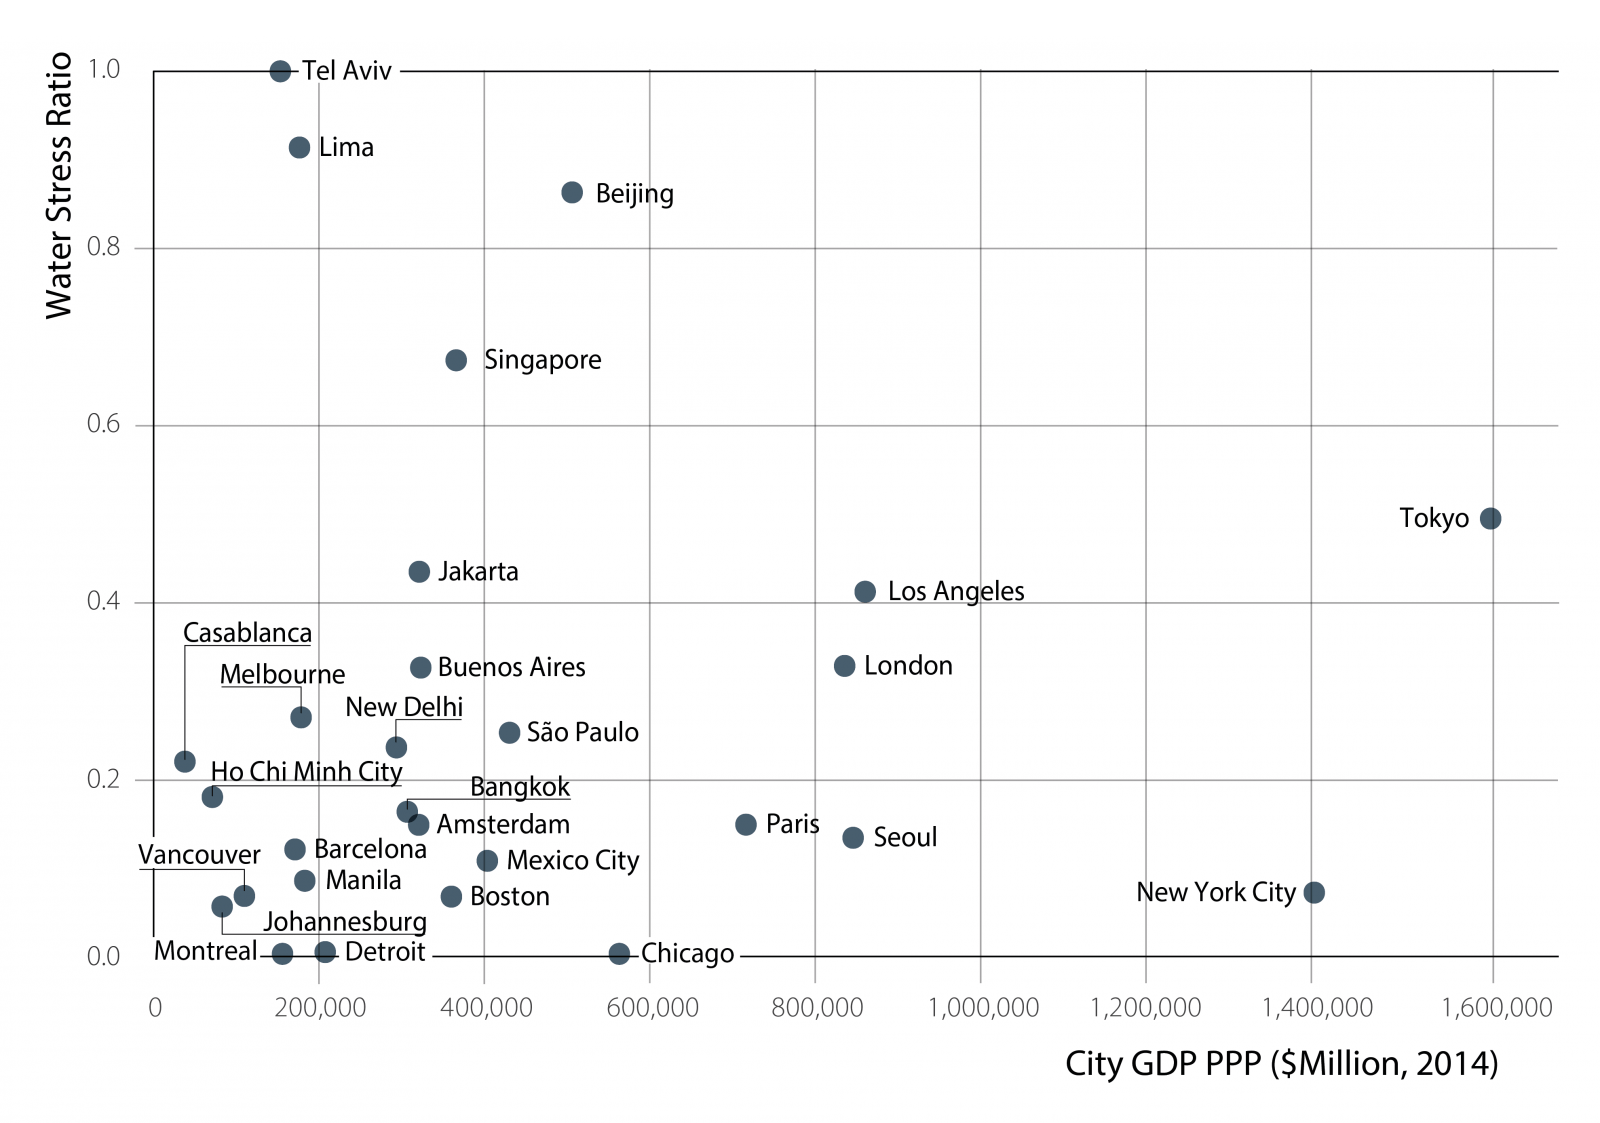
Figure 3. Levels of water stress relative to cities’ GDP PPP ($ in 2014) for UESI pilot cities. (Data sources: Urban Water Blueprint; Brookings Metro Monitor). See the Cities Page for a full exploration all cities’ water stress levels.
Globally, implementing strategies to protect water sources – by protecting or restoring forests, implementing agricultural best management practices, restoring riparian habitats, and reducing forest fuel – could save $890 million USD per year on treatment plant operations and management, freeing up capital for infrastructure improvement and development.100McDonald, R. I., Weber, K., Padowski, J., Flörke, M., Schneider, C., Green, P. A., … & Boucher, T. (2014). Water on an urban planet: Urbanization and the reach of urban water infrastructure. Global Environmental Change, 27, 96-105. Reducing vulnerability to water stress may also require working with other stakeholders and water users. Flörke et al.’s survey of nearly 500 cities found that improvements in agricultural water-use efficiency could free up enough water for urban use in 80 percent of future “high-conflict” watersheds, where urban and agricultural sectors would struggle to both meet their projected water demands.101Flörke, M., Schneider, C., & McDonald, R. I. (2018). Water competition between cities and agriculture driven by climate change and urban growth. Nature Sustainability, 1(1), 51.
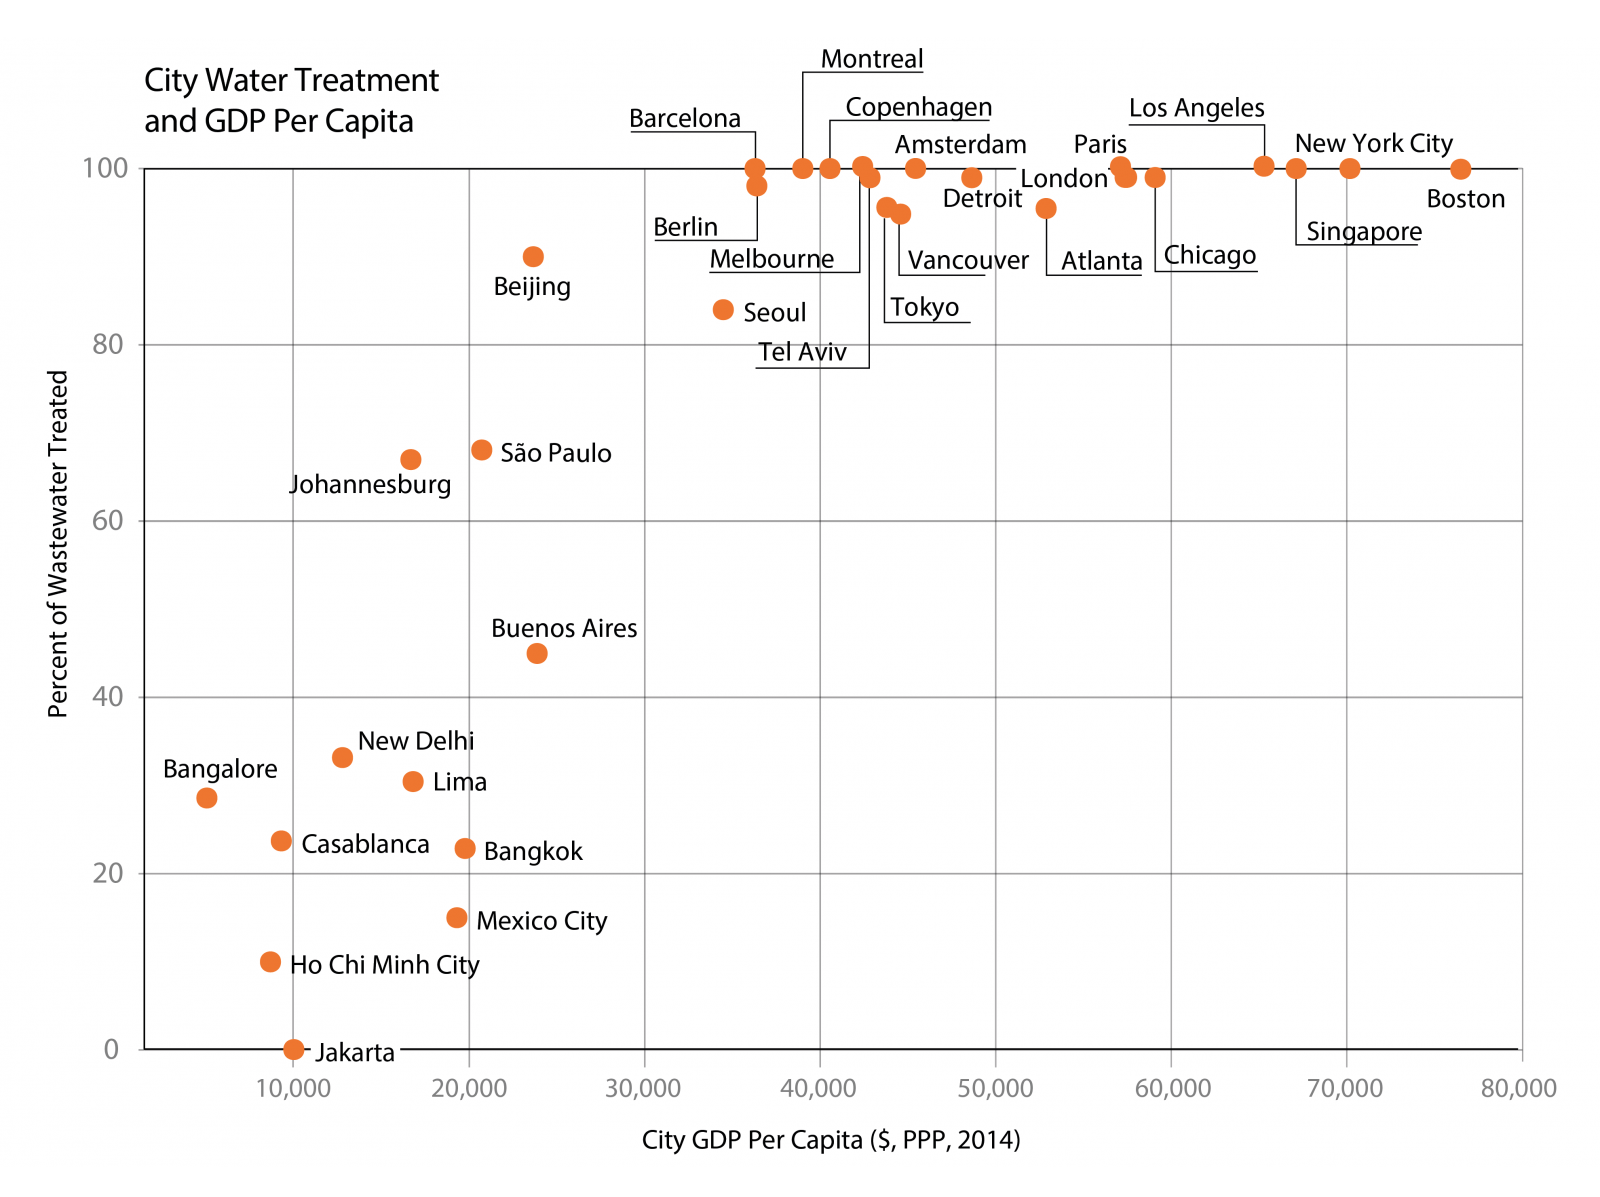
Figure 4. Percent treated wastewater (relative to total generated urban wastewater) relative versus cities’ GDP Purchasing Power Parity (PPP) per capita (PPP, $ in 2014) for UESI pilot cities. (Data sources: Percent treated wastewater from UESI wastewater indicator; city GDP data from Brookings Metro Monitor).
Effective wastewater treatment strategies can also help cities reduce their water stress, by freeing up water for reuse. Singapore, which treats nearly 100 percent of its wastewater, has implemented an aggressive water reuse and recycling program to help offset its limited freshwater resources.102Duer, R.S. (25 June 2013). Singapore’s “toilet to tap” concept. Deutsche Welle (DW). Retrieved from: http://www.dw.com/en/singapores-toilet-to-tap-concept/a-16904636. Similarly comprehensive wastewater strategies could aid water-stressed cities like Beijing, Jakarta, and Los Angeles address the threat of water scarcity.
Across the UESI pilot cities, wastewater treatment reflects global trends – treatment levels are highest, for the most part, in high-income countries, and lowest in low-income areas (see Figure 4). No city-level data is available for Manila, likely reflecting the difficulty of tracking the treatment of septic systems, but making it difficult to assess the impact of wastewater on the city. Data tracking coverage and treatment within cities is scarce, but globally, sewerage coverage and wastewater treatment remains an especially pressing challenge for informal settlements.