Data and Software
This page is under construction. Check back often for updates, or on our GitHub page or UNC Dataverse page.

Citizen and Machine Learning-aided high-resolution mapping of urban heat exposure and stress
Wang, X., Hsu, A., and T.C. Chakraborty. (2022). Replication data for: Citizen and Machine Learning-aided high-resolution mapping of urban heat exposure and stress. https://dataverse.unc.edu/dataset.xhtml?persistentId=doi%3A10.15139%2FS3%2FZI9ER6&version=DRAFT. Data-Driven EnviroLab Dataverse.

Predicting European cities’ climate mitigation performance using machine learning
Hsu, A. Wang, X., Tan, J., Toh, W., and N. Goyal. (2022). Replication data for: Predicting European Cities’ Climate Mitigation Performance using Machine Learning Draft. https://dataverse.unc.edu/dataset.xhtml?persistentId=doi%3A10.15139%2FS3%2FNRJ5ZO&version=DRAFT. Data-Driven EnviroLab Dataverse.

Heat Data Visualization for PocketLab Sensor
To help students, teachers, and researchers visualize the heat data collected by PocketLab sensors during their Urban Heat study, we developed Heat Data Visualization for PocketLab Sensor — a fast and light google Colab notebook. This visualization is available under a Creative Commons License: Attribution-NonCommercial 4.0 International (CC BY-NC 4.0).
Citation: Hua, H. and Wang, X (2022). Heat Data Visualization for PocketLab Sensor. Available: Data-Driven EnviroLab.https://datadrivenlab.org/data-and-software/

Net-Zero Tracker
In partnership with Oxford University, The Energy and Climate Intelligence Unit, and the NewClimate Institute, we developed a dashboard that tracks and evaluates net-zero pledges around the world.

ClimActor: Harmonized transnational data on climate network participation by city and regional governments
Data-Driven Envirolab has developed the largest global database of city and regional government participation in climate action. Citation: Hsu, A., Yeo, Z.Y., Rauber, R. et al. ClimActor, harmonized transnational data on climate network participation by city and regional governments. Sci Data 7, 374 (2020). https://doi.org/10.1038/s41597-020-00682-0
- Datasets (CSV) via or our figshare or GitHub page
- ClimActor R package – data loads as an RData object when the package is loaded (
devtools::install_github("datadrivenenvirolab/climactor", build_vignettes = TRUE) - Video tutorial on package use

Sustainable and inclusive – Evaluating urban sustainability indicators’ suitability for measuring progress towards SDG-11
Replication data for: Thomas, R., A. Hsu, and A. Weinfurter. Sustainable and inclusive – Evaluating urban sustainability indicators’ suitability for measuring progress towards SDG-11. Environment and Planning B: Urban Analytics and City Science (2020). https://doi.org/10.1177/2399808320975404. Citation:

United States - Surface Urban Heat Island Intensity Explorer
This platform displays census-tract level surface urban heat island (SUHI) intensities for US urbanized areas as well as socioeconomic information at the same level of aggregation. Citation: Chakraborty, T., Hsu, A., Manya, D., & Sheriff, G. (2020). A spatially explicit surface urban heat island database for the United States: Characterization, uncertainties, and possible applications., ISPRS Journal of Photogrammetry and Remote Sensing.

Performance determinants show European cities are delivering on climate mitigation
Hsu, A., Tan, J., Ng, Y.M., Vanda, R. and N. Goyal. (2020). Replication data for: Performance determinants show European cities are delivering on climate mitigation. https://doi.org/10.7910/DVN/IJ4DDI, Harvard Dataverse, V1.

The Urban Environment and Social Inclusion Index
Hsu, A., N. Alexandre, J. Brandt, T. Chakraborty, S. Comess, A. Feierman, T. Huang, S. Janaskie, D. Manya, M. Moroney, N. Moyo, R. Rauber, G. Sherriff, R. Thomas, J. Tong, Y. Xie, A. Weinfurter, Z. Yeo (in alpha order), et al. (2018). The Urban Environment and Social Inclusion Index. New Haven, CT: Yale University. Available: datadrivenlab.org/urban.
All data are available for download here: https://datadrivenlab.org/urban/about/downloads/.
2016 Environmental Performance Index - Full Report
The 2016 Environmental Performance Index (EPI) ranks 180 countries on air quality, water and sanitation, fisheries, forestry, biodiversity and habitat, and climate change and energy. For more information see: www.epi2016.yale.edu.
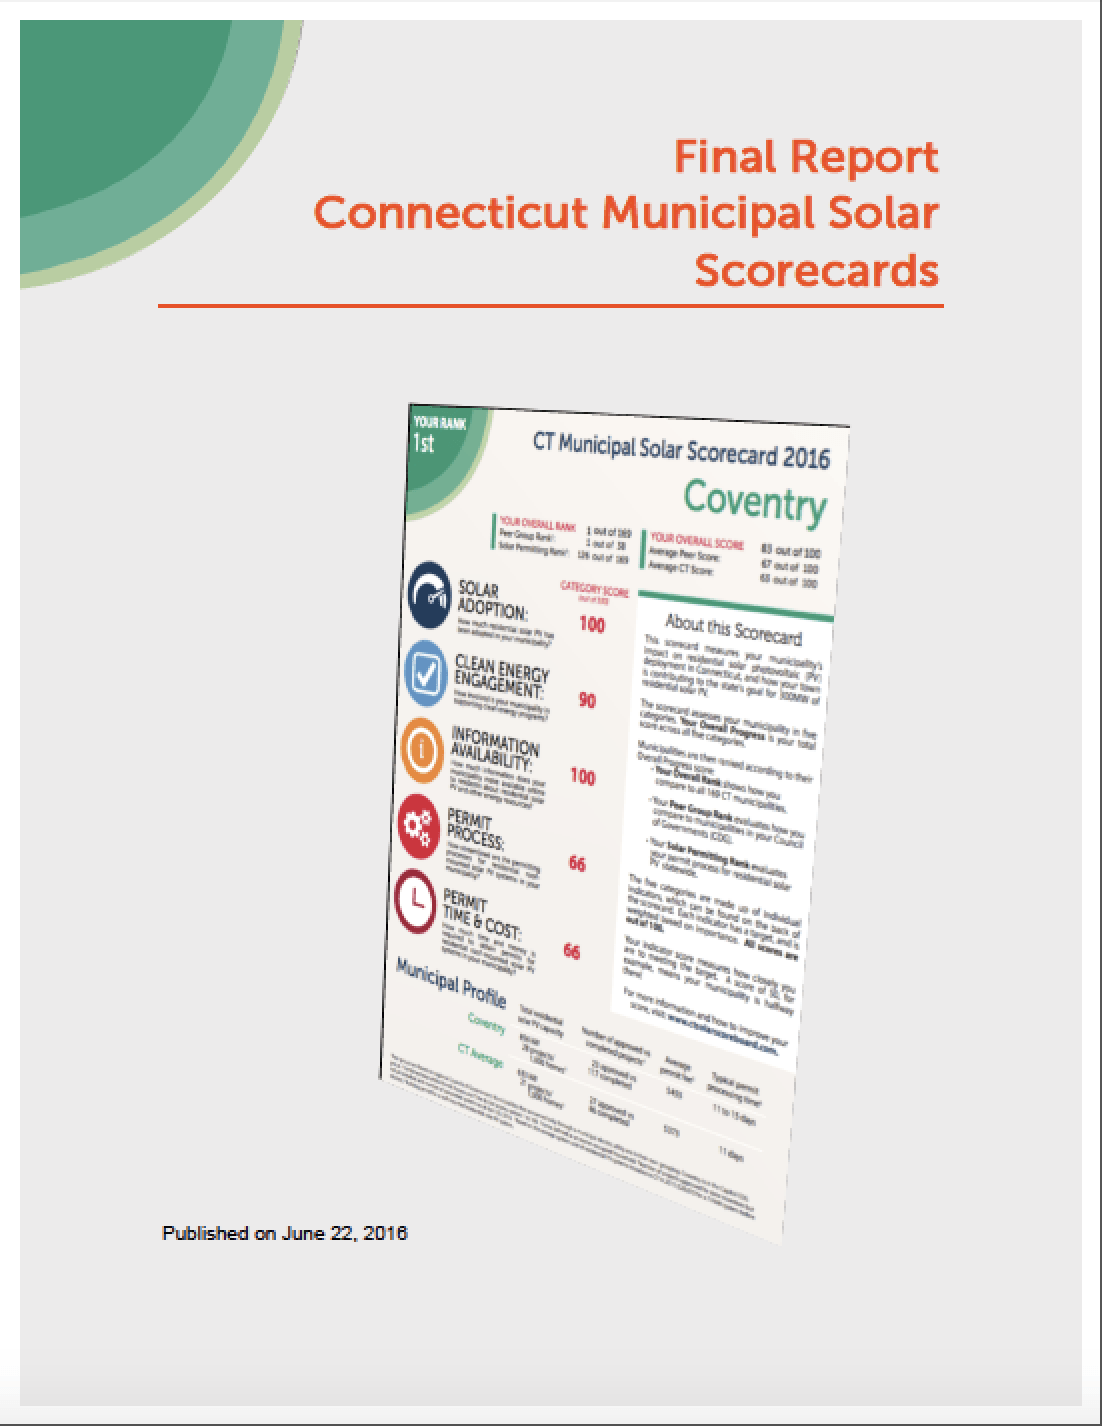
CT Solar Scorecards
In partnership with the Connecticut Green Bank, Data-Driven Yale developed scorecards ranking residential solar PV in each of the state’s 69 towns. See the website and final report here: http://www.ctsolarscoreboard.com/.