On August 28, 2021, we sent nearly 40 volunteers armed with handheld sensors, smartphones, and smartwatches to help collect urban heat data around town. This citizen science campaign was in partnership with the NC Museum of Life and Science and the Town of Chapel Hill, and is part of our effort to better understand the urban heat island (UHI) effect in Chapel Hill. Our volunteers collected 46 temperature data files and nearly 200 heat comfort data points, and a total of more than 95 thousand data points.
Since August, we’ve been organizing, analyzing, and visualizing the data to distill valuable insights about the UHI effect in Chapel Hill. We’ve compiled our data and analysis into our 2021 Chapel Hill Urban Heat Watch data release report. The report features data, maps, graphs, and other figures that visually explore the data our citizen scientists collected. We also hosted a webinar on March 3 discussing the campaign results with our partners. That recording is available here.
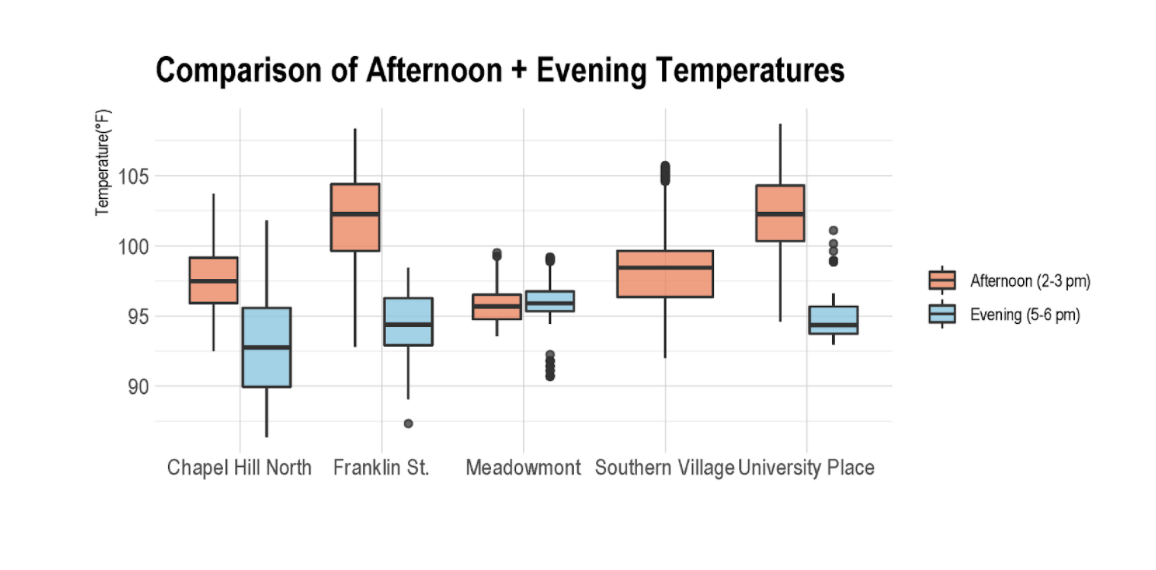
What we found was surprising. Despite temperatures for Chapel Hill averaging between 71 and 93 degrees F during August, our citizen science mappers measured temperatures between 92 and 109 degrees F in the five neighborhoods mapped: Chapel Hill North, Franklin Street, Southern Village, University Place, and Meadowmont during 2-3 pm in the afternoon, when temperatures often reach the highest in an urban area. While temperatures cooled down to between 86 and 101 degrees F during our evening mapping session from 5 to 6 pm, they were still much higher than the typical average observed temperatures during late August in Chapel Hill. Nighttime UHI intensity is a particularly important indicator for human health, as sustained and prolonged exposure to urban heat can intensify heat-related illnesses.
Other results were less surprising, but have implications for considering heat mitigation measures or policies to warn people during extreme heat events of potentially intensified heat exposure. Neighborhoods with a greater proportion of built environment like Franklin St. and University Place were on average hotter than other neighborhoods our volunteers mapped, like Meadowmont and Chapel Hill North. For Franklin Street, the density of people, buildings, transportation, and paved surfaces is likely an underlying contributor to these higher than average temperatures. University Place, even though it is less densely built, has large paved surface parking lots and relatively less tree cover, making patrons there potentially more vulnerable to high heat exposure. These two neighborhoods also showed the greatest differences between early afternoon and evening temperatures.
We are in the process of developing a machine-learning-based model using these data inputs along with other satellite images of Chapel Hill’s tree and land cover to estimate heat intensity on parts of Chapel Hill where we didn’t send citizen scientists on foot to measure. This analysis will provide a full map of heat exposure for Chapel Hill as a way of informing potential hotspots of heat exposure and possible heat stress for residents living or working in these areas.
We have also made the data open to the public for anyone who is interested in using the data or analyzing it. Members of the public will have the opportunity to work with the data along with other datasets through our HeatHack Data Science Collabathon during the 2022 NC Science Festival.
This hybrid in-person/remote one-day hackathon will bring together coders, programmers, data visualization whizzes, and environmental enthusiasts to help us discover actionable insights, develop engaging data visuals, and create action plans to address the growing and intensifying challenge of climate change and urban heat in the Triangle.
Teams will have the opportunity throughout the day to ask for feedback as they develop their ideas and final products, and at the end, a panel of judges composed of community stakeholders will provide feedback and award prizes for the winning entries. Several webinars will be hosted ahead of the event that bring climate and data scientists to provide free community data science training.
To learn more about the event and to register, visit https://datadrivenlab.org/heat-hack-2022/.
Trackbacks/Pingbacks