The Urban Environment and Social Inclusion Index, first launched in 2018, is the only spatially-explicit index that shows on a neighborhood-by-neighborhood basis how cities perform on Sustainable Development Goal 11’s charge for inclusive urban development.
The 2022 update now measures nearly 300 cities, with the majority located in Asia (30% or 82 cities) and Europe (30% or 88 cities) and an increase of 20 cities from the Global South.
The latest results find that over half of the cities fail to provide environmental benefits equally among citizens, even among cities performing above average on environmental indicators like air quality, tree cover, sustainable transport access, and urban heat.
While cities around the world are taking action to combat climate change, a recent analysis of the Urban Environment and Social Inclusion (UESI) Index finds equity to be the next global challenge.
First launched by the Data-Driven EnviroLab in 2018, the UESI is a first-of-its-kind tool that leverages high-resolution, large-scale data to reveal how cities perform at the intersection of environment and social equity. As the only spatially-explicit urban index that provides comparable data and metrics on a neighborhood by neighborhood scale, the UESI allows cities to understand how residents experience urban environments in vastly different ways and to benchmark their performance with other cities around the world.
The 2022 update includes nearly 300 cities and finds overall positive progress in global city performance. 60% (171 out of 285) of participating cities perform above average on environmental indicators like air pollution, urban heat, tree cover, and sustainable transit access Cities in Asia and the Global South perform below average, signaling more room to improve.
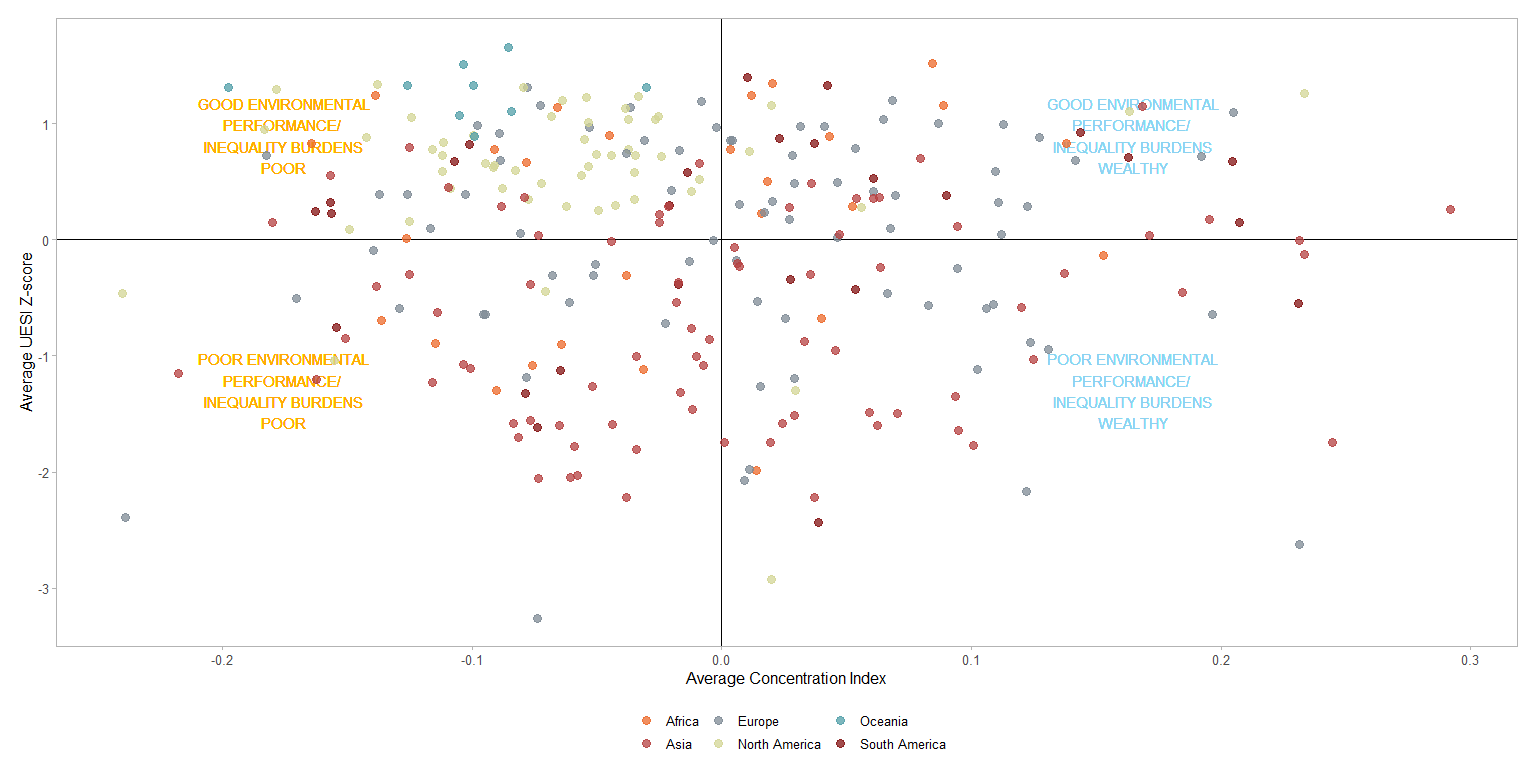
Figure 1. A four-quadrant plot examining the relationship between environmental performance (in terms of average z-score indicating the distance from the mean for or a city’s average performance on the UESI indicators) and equity (in terms of average concentration index). Cities towards the top of the chart perform better on environmental issues, while cities towards the bottom of the chart perform worse. Along the horizontal axis, the farther away cities are from the center of the figure, the more unequally environmental burdens are distributed. In cities towards the right-hand side of the figure, wealthier neighborhoods are more heavily burdened, while in cities towards the left-hand side of the figure, poorer neighborhoods are more heavily burdened.
Despite the overall above-average performance of most cities, the UESI has also found imbalances in the distribution of cities’ environmental benefits and harms. 56% (161 out of 285) of cities are burdening less wealthy neighborhoods with poorer air quality, more exposure to urban heat, and a general lack of access to tree cover and public transport.
“The latest UESI results show promise but also worry. Although the majority of cities have lowered air pollution and provided sustainable transport and tree cover, they’re not providing these benefits equally to all. Even cities like Copenhagen, which have been called the ‘bicycle kingdom’ and are viewed as an urban sustainability leader, have room to improve in ensuring that all of its residents, regardless of income, have the same access,” said Professor Angel Hsu, director of the Data-Driven EnviroLab and the UESI’s Principal Investigator.
The Index also provides a continent-by-continent analysis: :
- North America has the largest number of most environmentally well-performed UESI cities compared to other continents. However, the majority of North American cities fail to provide these benefits to all urban residents equally.
- More than half of the UESI cities are from Europe and Asia. 60% (53 out of 88) of the European cities perform better than the average, while 70% (58 out of 82) of Asian cities still have room to improve.
- In Africa, South America, and Oceania, four new African cities and 16 South-American cities have been added since 2018. Each city varies in performance, but overall, people living in Rosario, Philippines, Monrovia and Liberia share environmental benefits among their residents more equally. While the addition of these Global South cities is a step forward in the UESI’s goal to be more globally representative, data availability is a primary obstacle to including more cities from these regions.
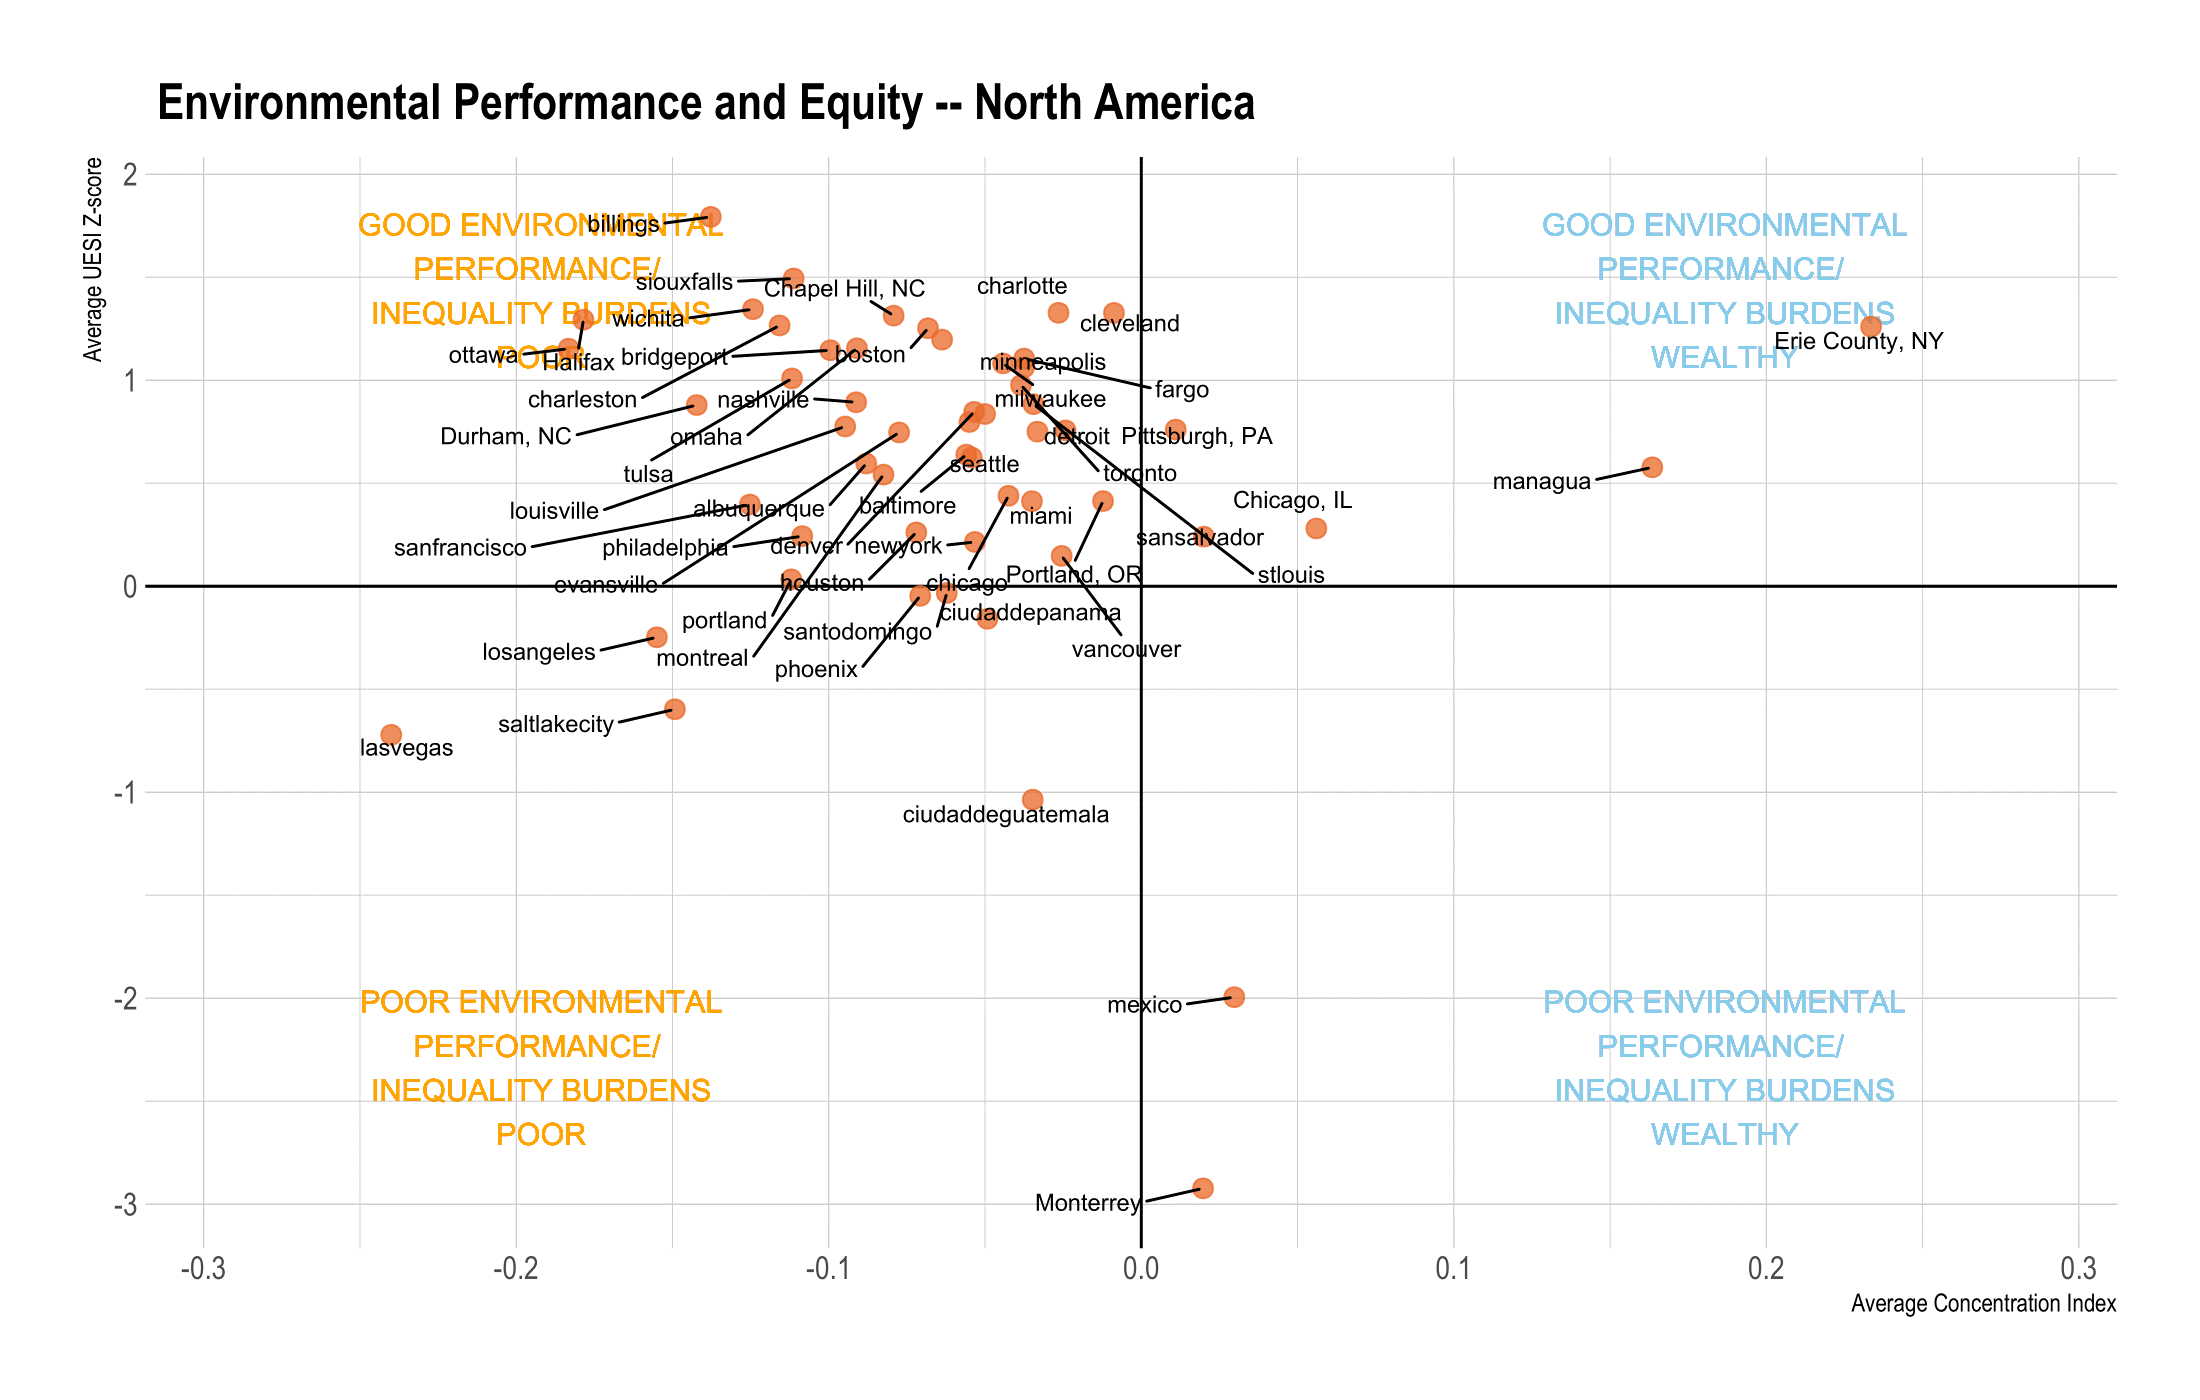
a) North America
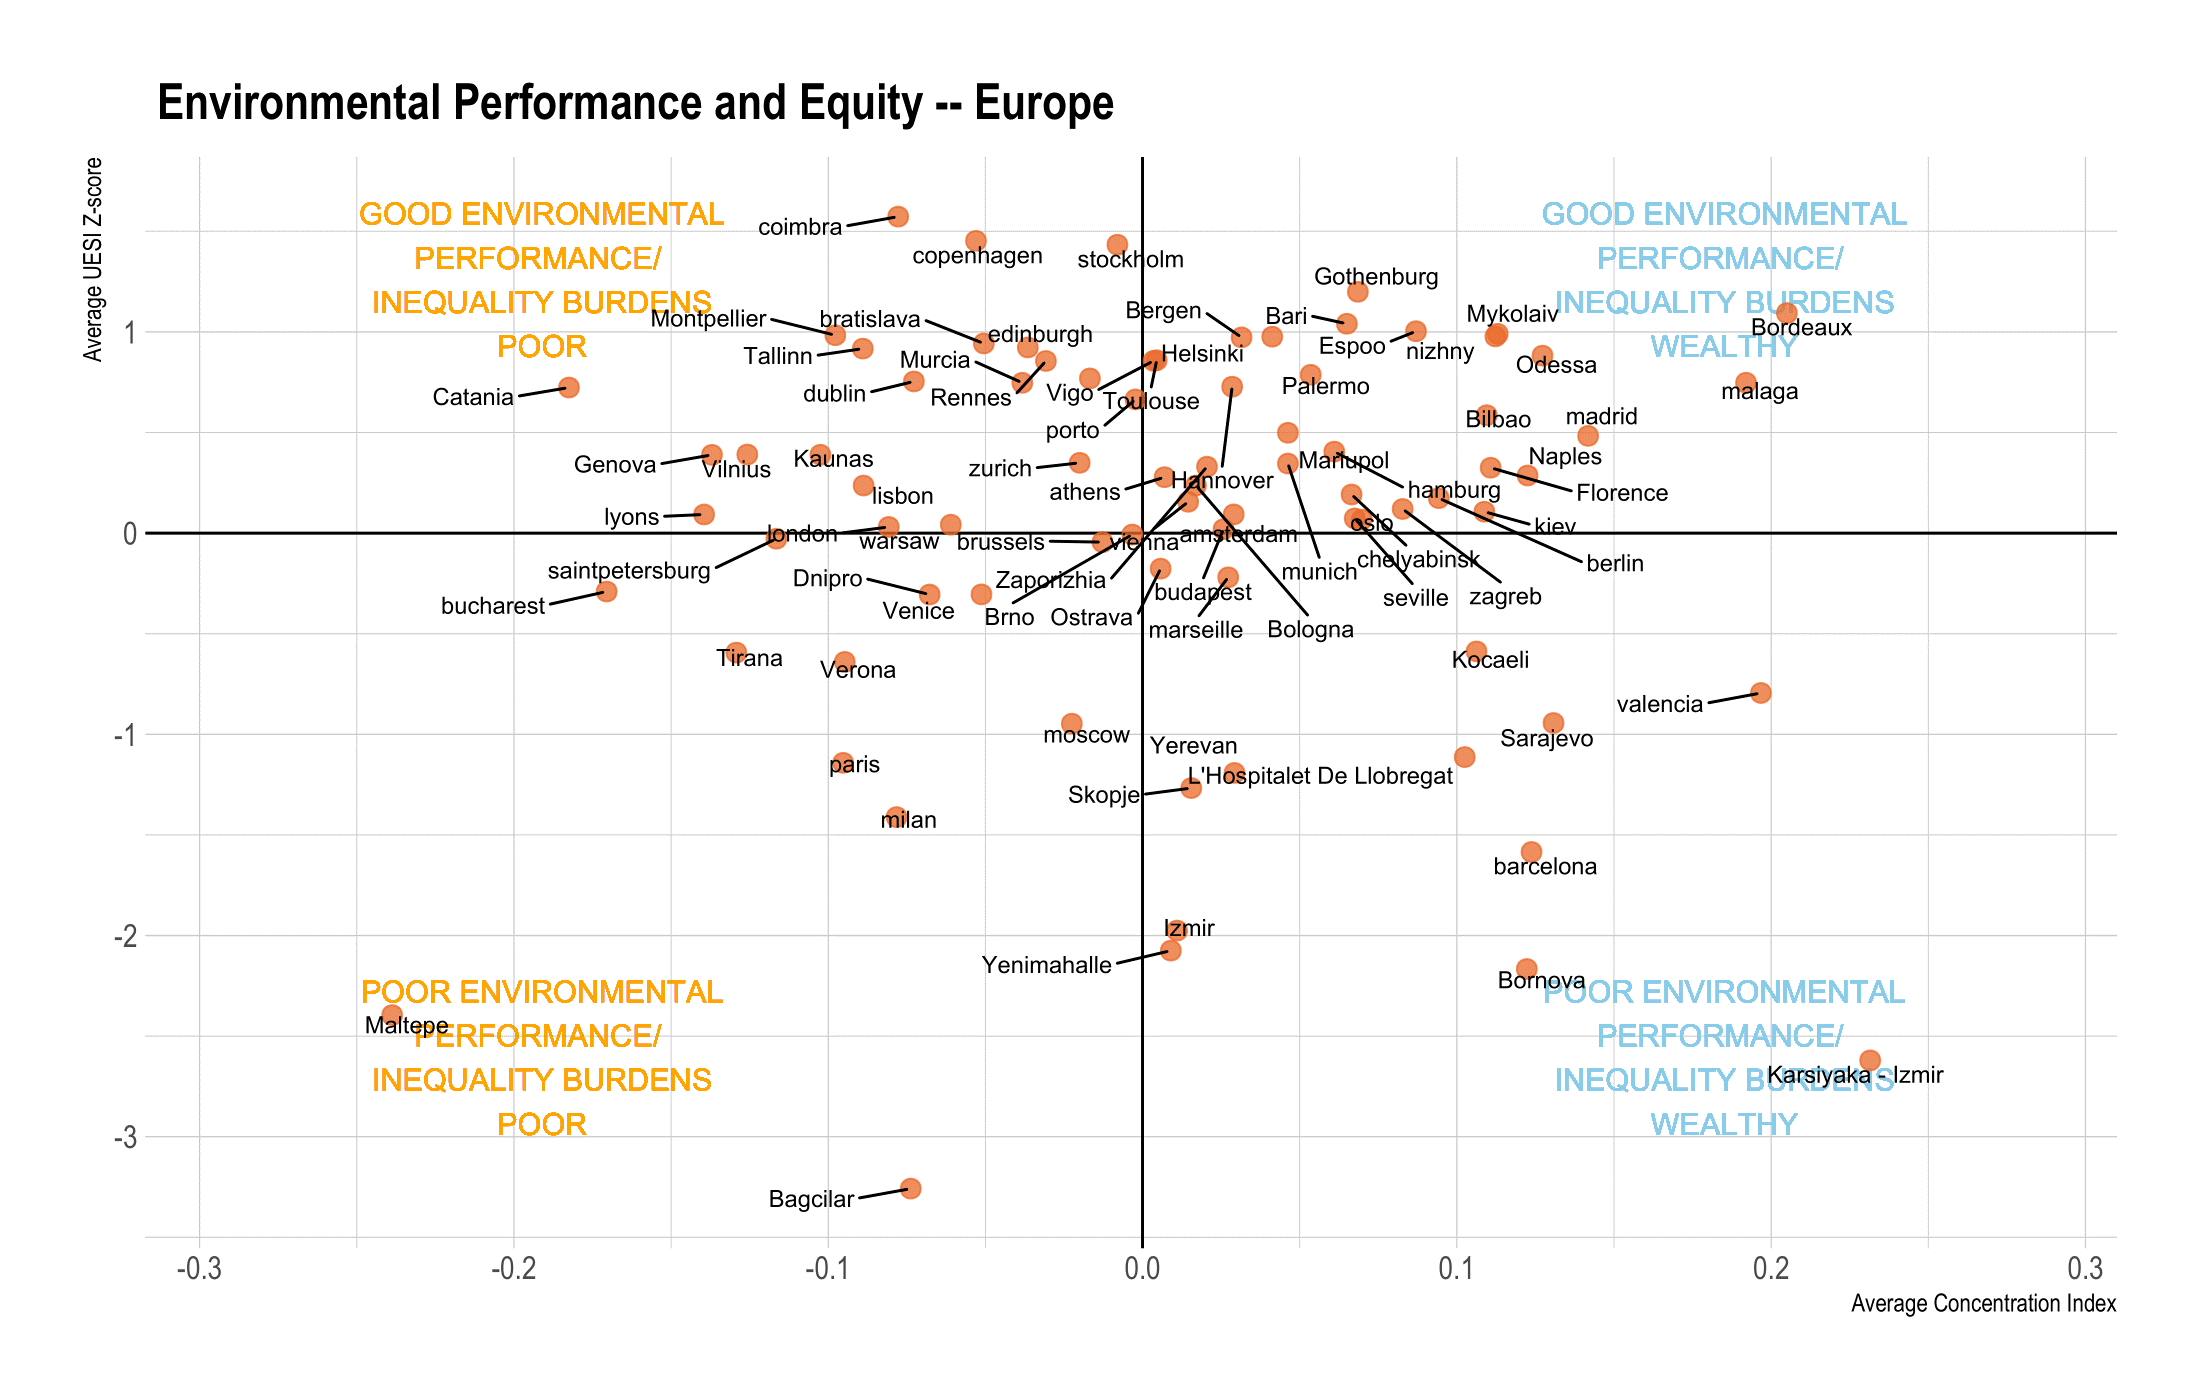
b) Europe
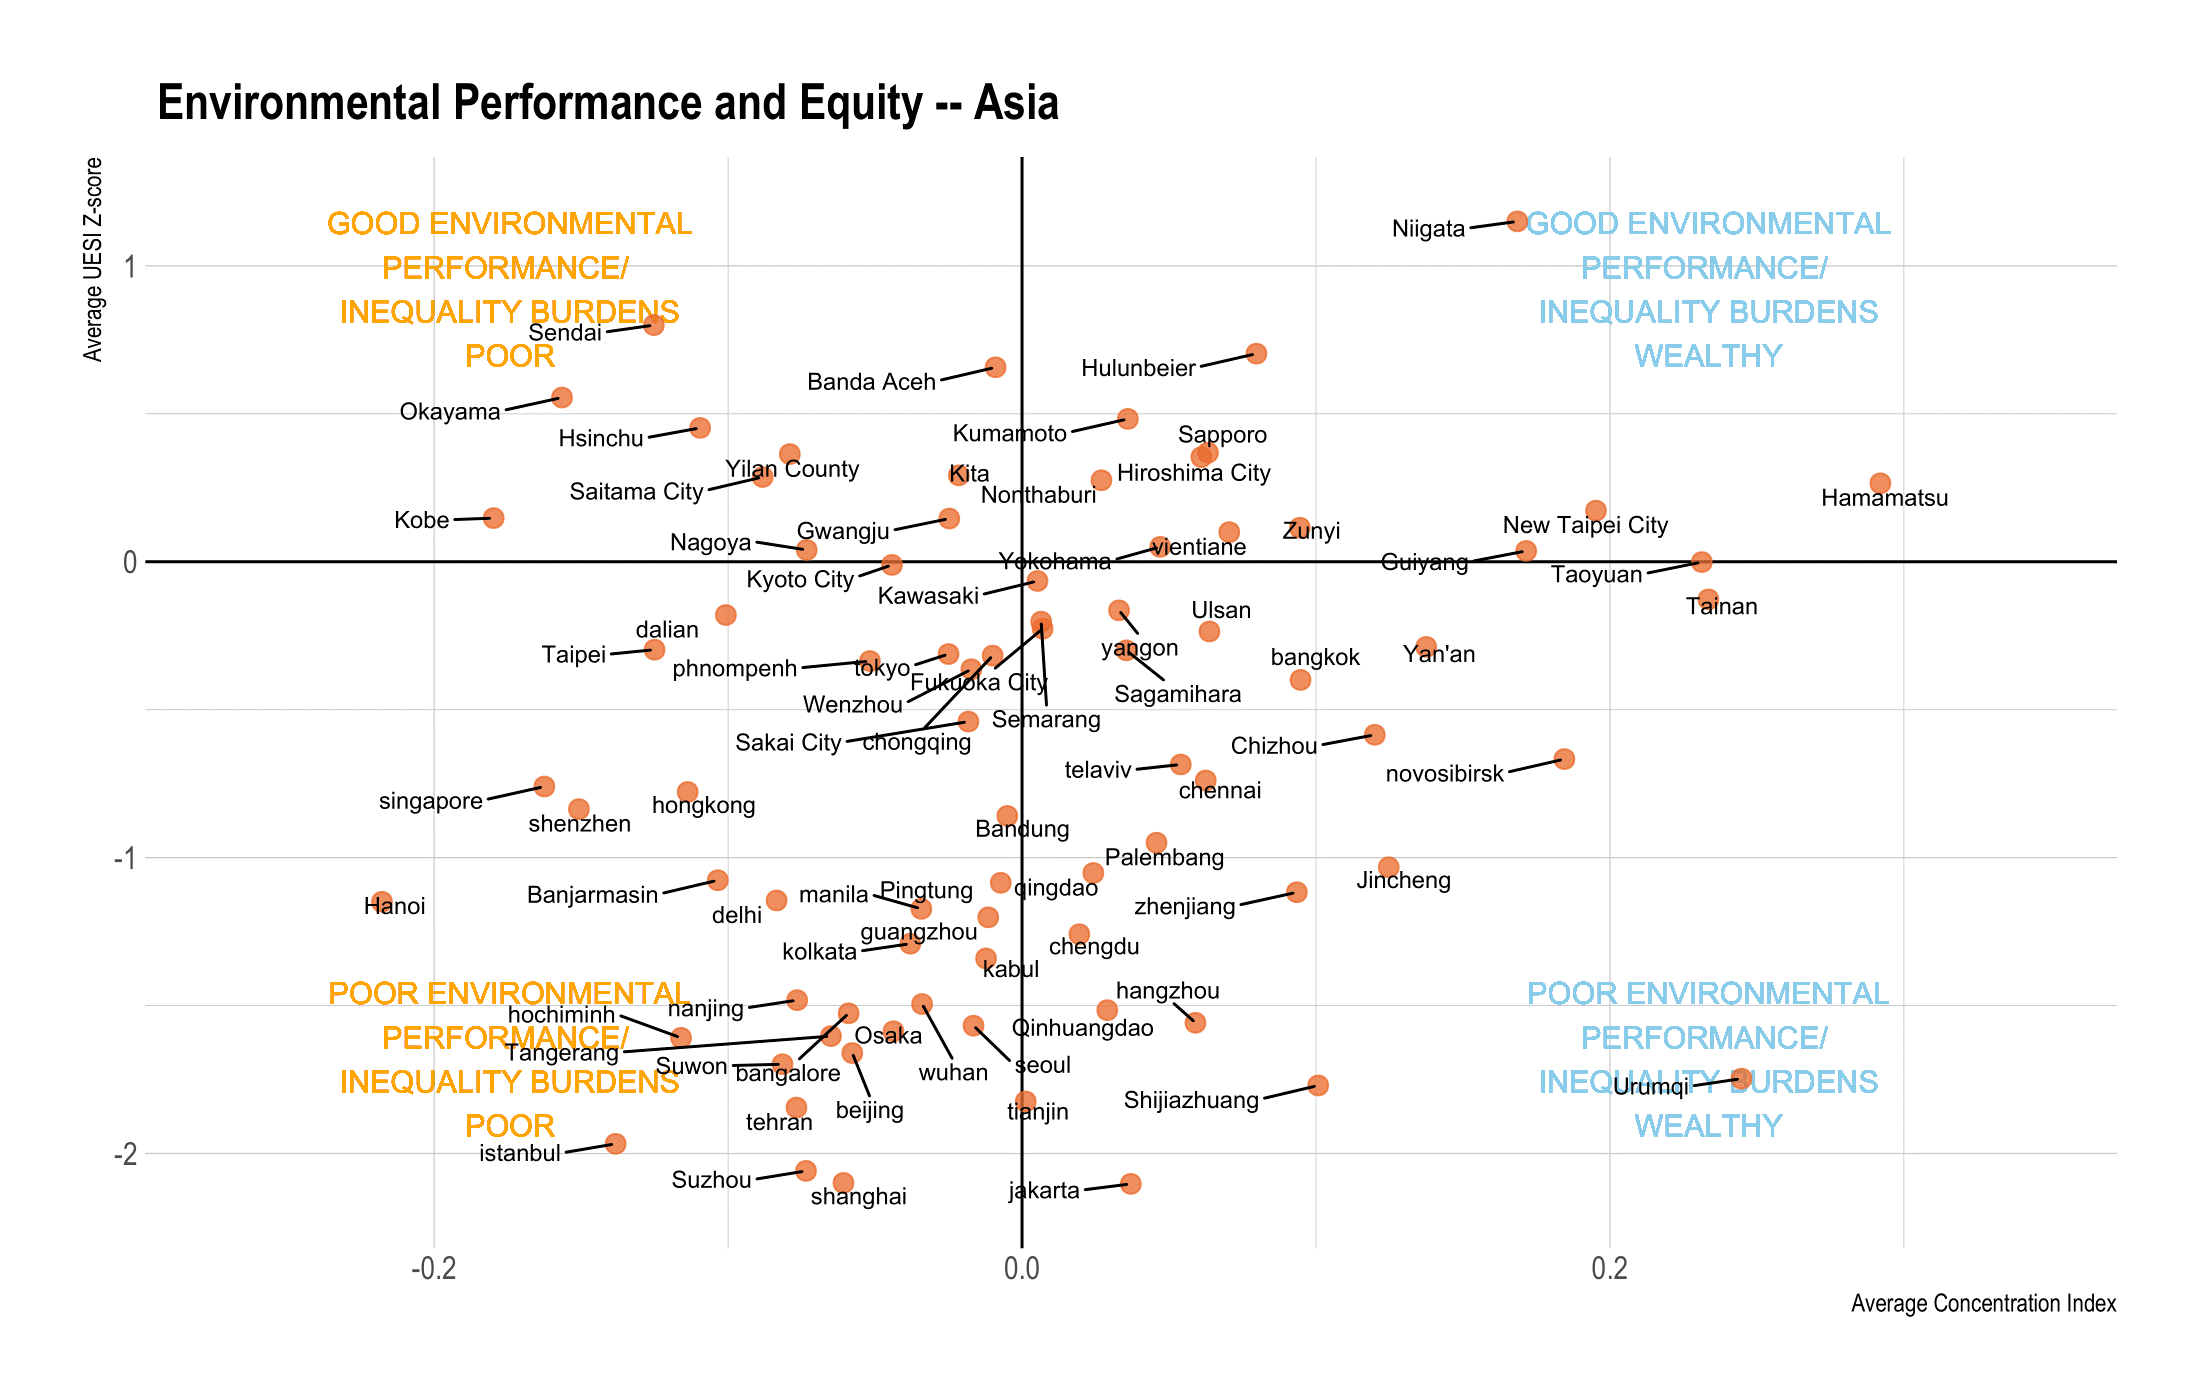
c) Asia
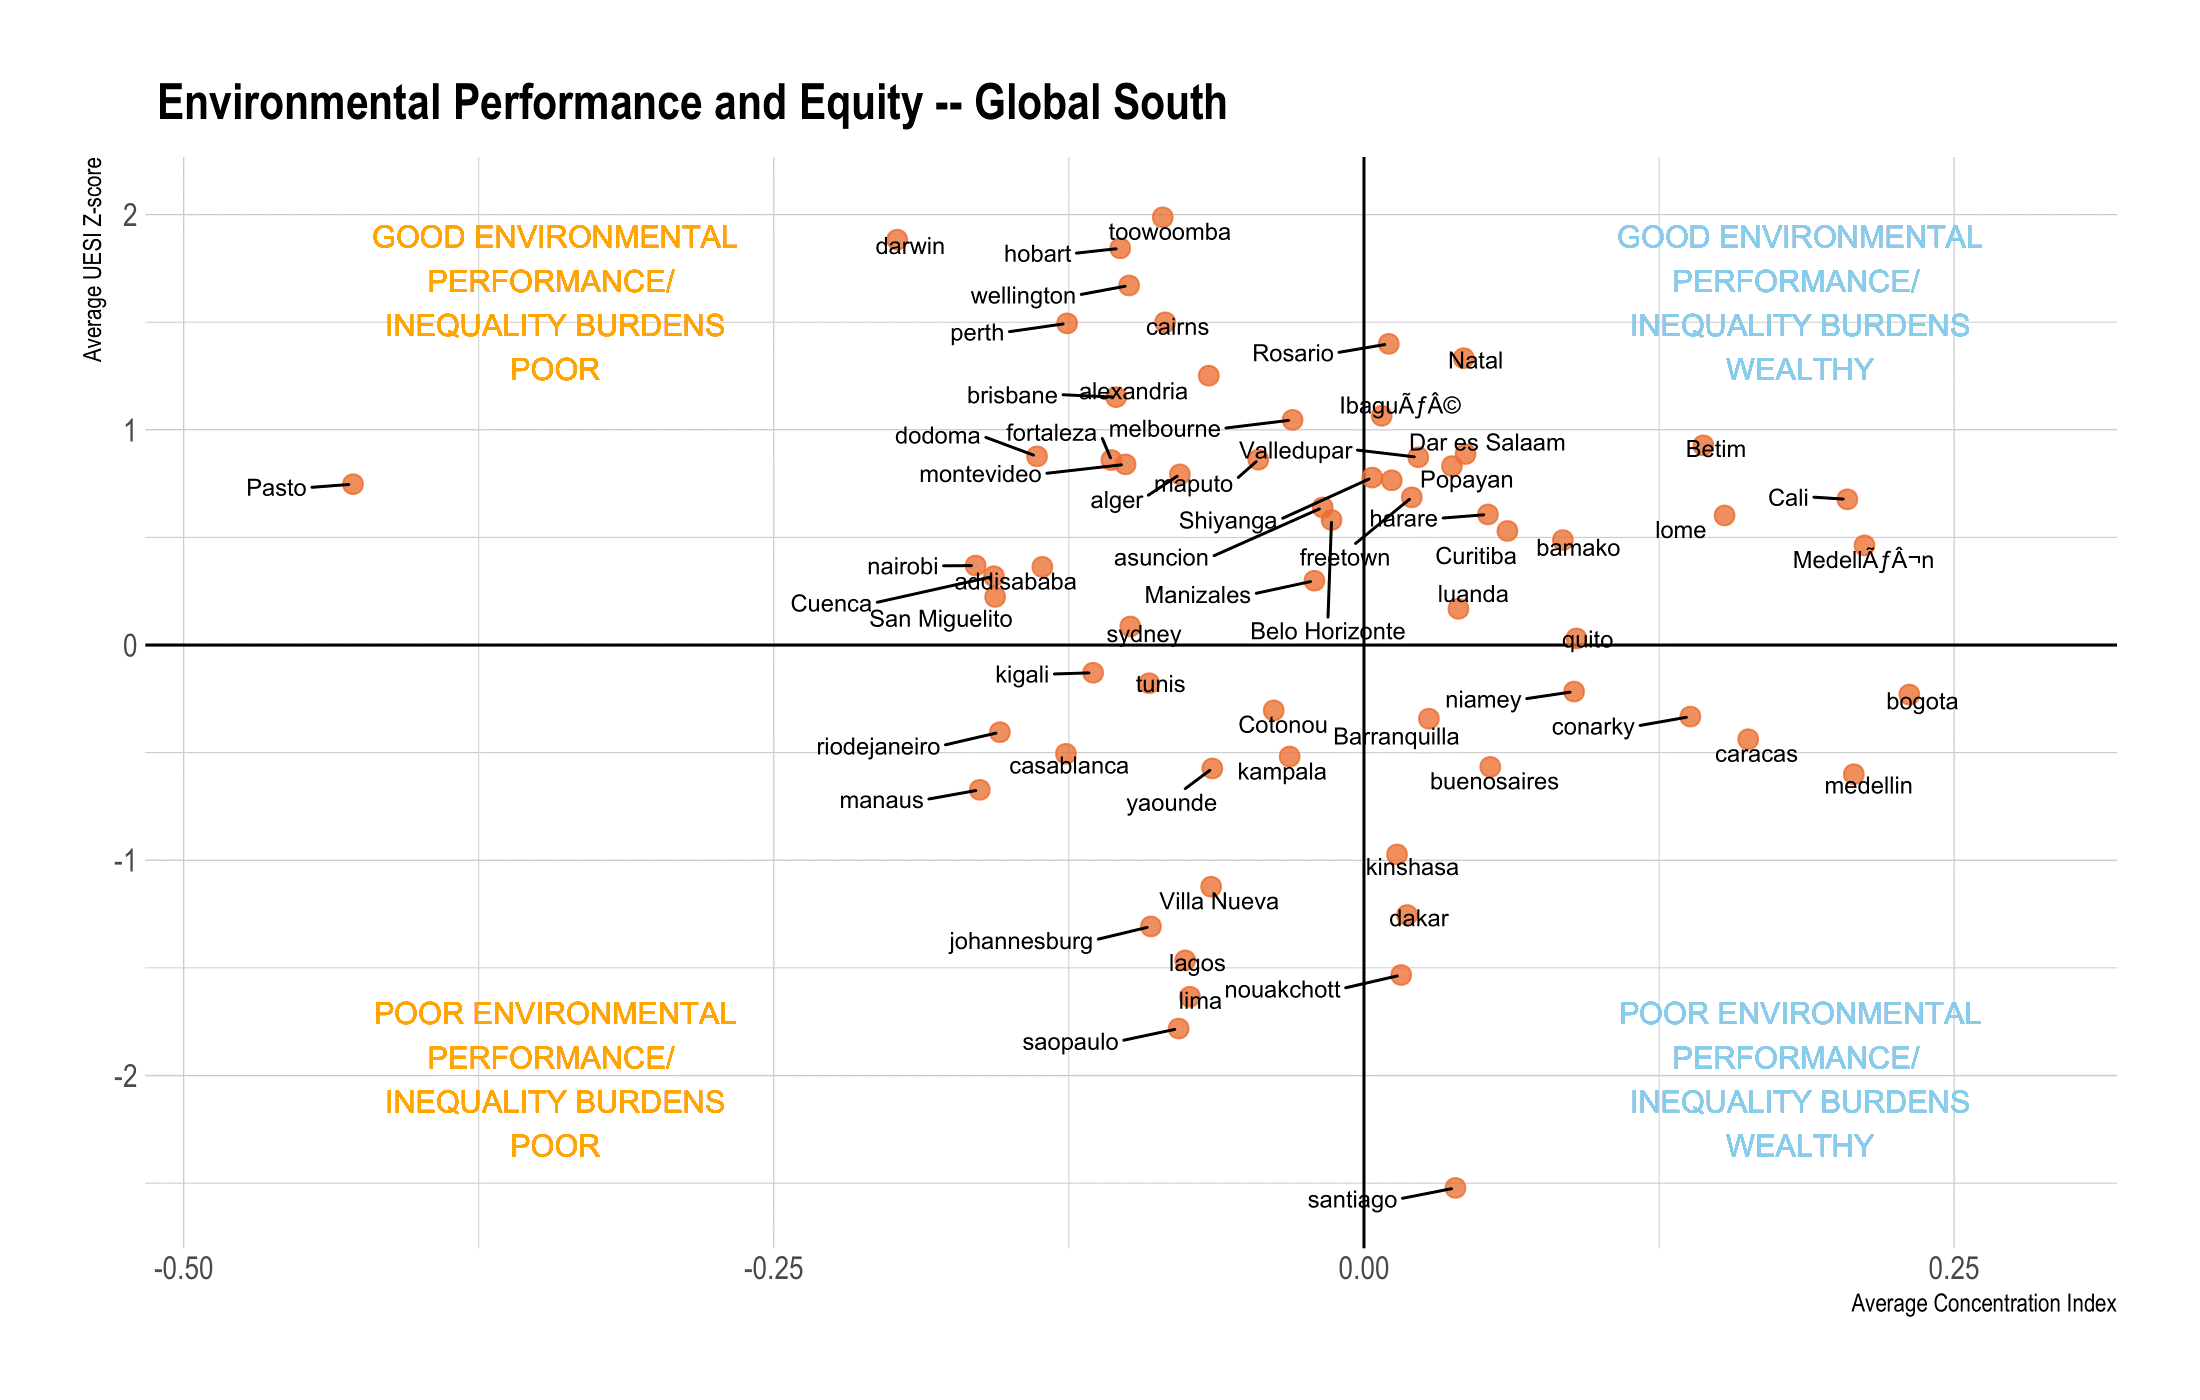
4) The Global South (Africa, South America, and Oceania)
Figure 2. Regional plots showing how cities perform along the UESI’s two main dimensions: environment and social inclusion for a) North America; b) Europe; c)Asia and d) the Global South, which includes Africa, South America, and Oceania. Cities towards the top of the chart perform better on environmental issues, while cities towards the bottom of the chart perform more poorly. Along the horizontal axis, the farther away cities are from the center of the figure, the more unequally environmental burdens are distributed. In cities towards the right-hand side of the figure, wealthier neighborhoods are more heavily burdened, while in cities towards the left-hand side of the figure, poorer neighborhoods are more heavily burdened. For more explanation, see datadrivenlab.org/urban.
For the first time, this year’s index provides trend indicators for the UESI’s previous 165 cities. Some cities have shown significant progress in improving urban sustainable equity For example, Stockholm, Tianjin, and Johannesburg have improved in our equity indicators, providing for more equitable environmental benefits and protection from environmental harms. Some cities like Barcelona and Berlin, however, have worsened in environmental equity.
“The fact that some cities are improving in environmental equity and others seem to be sliding indicates that no city can rest on its laurels. Even European cities like Berlin and Barcelona, which have historically performed well on our environmental indicators, must stay vigilant in ensuring they are working to provide equitable and inclusive urban sustainability. Through the UESI and our website, which provide detailed maps and dashboards for every city, we hope to provide researchers, government officials, and policy-makers with a user-friendly tool and informative visualizations of cities to guide decisions,” said Xuewei Wang, research data scientist of the Data-Driven EnviroLab and one of the lead researchers of the UESI Index.
The UESI is a partnership of the Data-Driven EnviroLab based at the University of North Carolina at Chapel Hill and the Samuel Centre for Social Connectedness based in Toronto, Canada. The latest findings will be available on the UESI’s website www.datadrivenlab.org/urban.
About Data-Driven EnviroLab (DDL):
Founded by Dr. Angel Hsu in 2016, Data-Driven EnviroLab is a research group based at the University of North Carolina at Chapel Hill with an interdisciplinary collaboration of policy experts, data scientists, visual designers, and interactive programmers. With a focus on sustainability and climate policy, DDL’s mission is to use cutting-edge data analytics to create solutions to the world’s environmental problems.
Recent Comments