
Customary generic image of a virus. Source: Unsplash/CDC.
Data scientists are stepping up in the fight against coronavirus. They are offering powerful digital tools that can provide both the public and policymakers with better information, potentially tipping the scales against the invisible enemy. Of these tools, Geographic Information System (GIS) technology is proving especially effective in this pandemic, with its ability to analyze huge chunks of spatial data and present them lucidly in smart maps. At Yale University, GIS expert Miriam Olivares and Data-Driven EnviroLab researcher TC Chakraborty are helping to build a series of COVID-19 maps that visualize the spread and impact of the virus locally and around the world, as part of a campus-wide initiative to create a centralized resource for understanding and addressing the pandemic.
With 19 years of geospatial experience, Miriam Olivares is the GIS Librarian at Yale’s Marx Science and Social Science Library (Marx Library), where she provides and coordinates support services for all geospatial projects. She has participated in numerous international GIS panels and workshops, and is featured in the Esri Press book, Women and GIS: Mapping their Stories. Her collaborations include interdisciplinary research in GIScience, crime analysis, natural hazards, and marine conservation. TC, who joined the Marx Library earlier this year as a geospatial consultant, is a PhD candidate at the Yale School of Forestry & Environmental Studies (F&ES) focusing on Atmospheric Science. He works with Data Driven EnviroLab as a researcher on the Urban Environment and Social Inclusion Index (UESI), which uses global satellite imagery, census records, and crowdsourced data from OpenStreetMap to measure the performance of cities at the intersection of environmental and social equity. TC has previously developed workshops on ArcGIS Desktop and the Javascript API of Google Earth Engine, a cloud-based platform for global-scale geospatial analysis. He has also written community tutorials on using the platform (Beginner’s Cookbook, Customizing Base Map Styles).
Together with Prof. Dana Tomlin, Dr. Jill Kelly, and the Yale School of Medicine’s Office of Communications, Miriam and TC are working to create compelling spatial representations of COVID-19 data sets for researchers and the public. They have published several maps, including a global case dashboard, a global spread timelapse, a case density by US county map, and a Connecticut town-level dashboard of COVID-19 cases. Several other mapping projects are in the works, including a recently released COVID-19 presence web app, which allows users to query estimates of possible cases at a resolution of less than 100 x 100 m (3 arc seconds) throughout the US.The initiative also incorporates maps from other researchers at Yale, including an interactive childcare display that uses data from the US Census to estimate childcare demand for the children of workers in critical sectors.
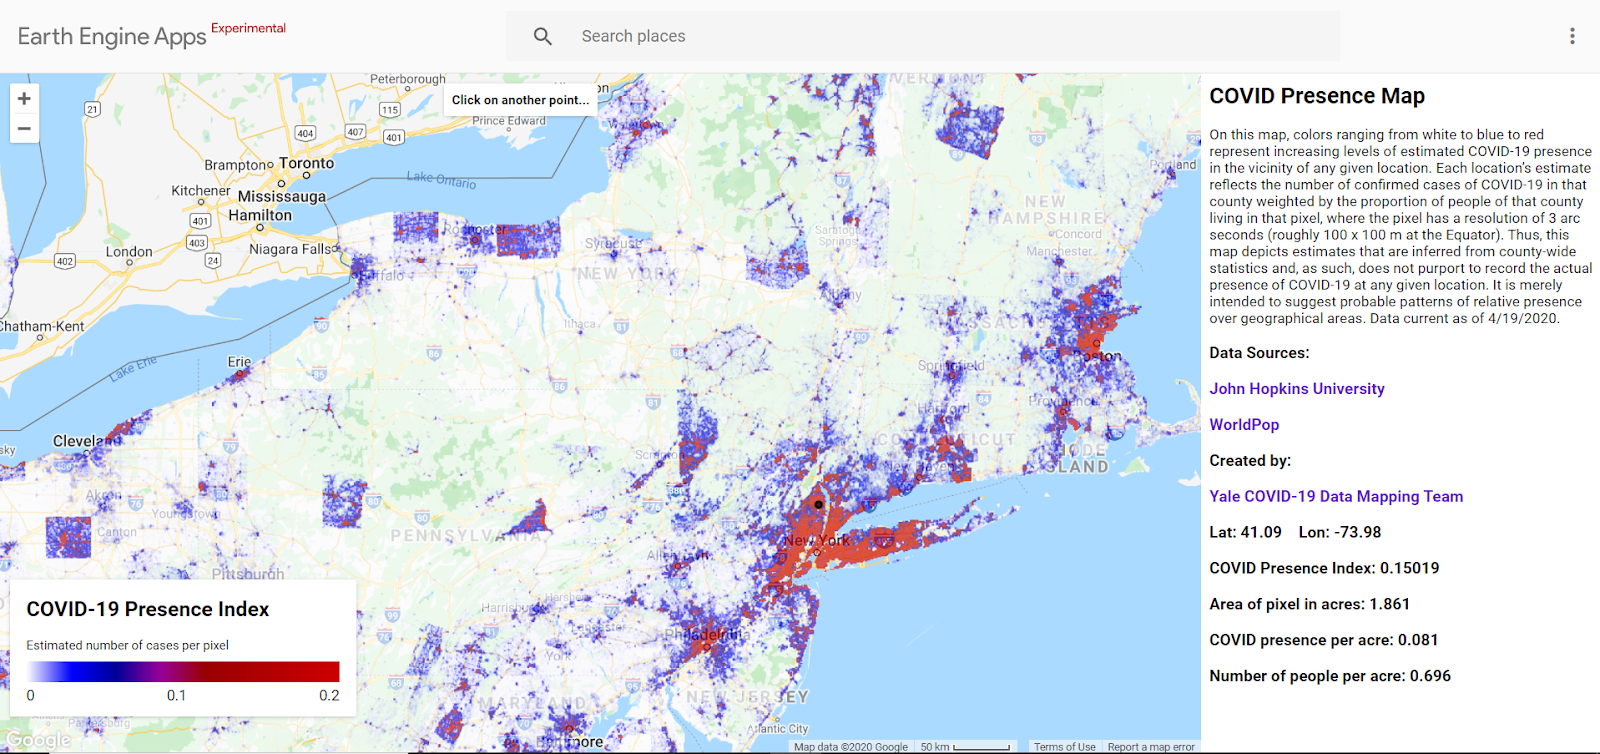
The Yale COVID-19 Presence Map allows users to query estimates of possible cases throughout the US at a resolution of less than 100 x 100 m.
“The goal is to have information that is interactive and easily digestible for the public,” TC said in an interview with Data-Driven EnviroLab. “These maps will also be important for decision-making and public policy down the road. Knowing how the pandemic progressed and how it was controlled–hopefully–will inform any future outbreaks—and there is always going to be that risk.”
“It’s about creating maps that are readable and relatable,” Miriam added. “One should not need to be a data scientist to understand what’s happening in their neighbourhood. Using techniques like hotspots and timelapses, having visualizations that help people realize the risks and severity of the situation–all of this can generate the awareness for greater social distancing, as far as circumstances allow.”
When asked about the future role of GIS, both TC and Miriam agreed on the increasing importance of the technology and extolled the convening power of university libraries to spearhead geospatial research. “I think this pandemic has shown us just how crucial spatial data is,” TC said. “Researchers are starting to see the value of high-resolution global data sets with the help of GIS librarians and consultants, but there needs to be more of a push. In public health research, for example, there’s a heavy reliance on cohort-based analysis, which can be more robust and less uncertain, but without the spatial component, one loses a lot of the information that could be important for examining environmental exposure and other kinds of stressors. I would love to be involved in more public health-related environmental research in the future that leverages satellite observations of environmental variables, particularly related to heat stress and air pollution in urban areas.”
On how agencies and academics could be more prepared for future crises, Miriam emphasized the need for greater collaboration and data standardization: “We should have open source or proprietary software where organizations and researchers can easily pull the data on a daily basis instead of having different platforms across the nation. We shouldn’t have to be scraping PDF files, which we still do quite often. We need to be ready from day one–we need to be quicker at deploying data analysis. The quicker the understanding, the quicker the response.”
The team has put out an open call for new proposals to explore creative ways to map original data sets. Click here to contribute.
Recent Comments