by Tuviere Onookome-Okome
During the summer of 2022, the Northeast has seen unprecedented temperatures. Boston broke its daily record, seeing temperatures reach 100 degrees at the Boston Logan International Airport (Source) where the previous record-high temperature was set at 98 degrees in 1993. Similarly, New York saw its longest heatwave in a decade. Previously, the city saw seven consecutive days of temperatures above 90 degrees from July 14-20, 2013. Up north in Canada, Montreal and Toronto also saw unbearable temperatures reaching over 80 degree celsius , although the humidity index estimated that temperatures felt much higher, even above 100 degrees (Source). Environment and Climate Change Canada warned that “very high temperatures or humid conditions are expected to pose an elevated risk of heat illnesses, such as heat stroke or heat exhaustion”.
There is growing concern globally of the effects of extreme weather, and in particular, concern around the increase of extreme heat events and of rising temperatures as a whole. Since 1880, the average temperature globally has risen by 1.1-1.3 degree Celsius per decade (Source). This rate has nearly tripled since the 1990s (Source).
The ways in which people experience heat can differ depending on what postal code they live in. This is especially true in the city of Montreal, Canada. The Data-Driven EnviroLab has collected satellite estimates of temperatures in Montreal and found that the western end of the Island of Montreal is less prone to the urban heat island effect due to a much lower population density and more tree cover (Source). On the other hand, the central and eastern parts of the Island are more susceptible to the urban heat island effect, due in part to differences in overall population density and a greater absence of tree cover.
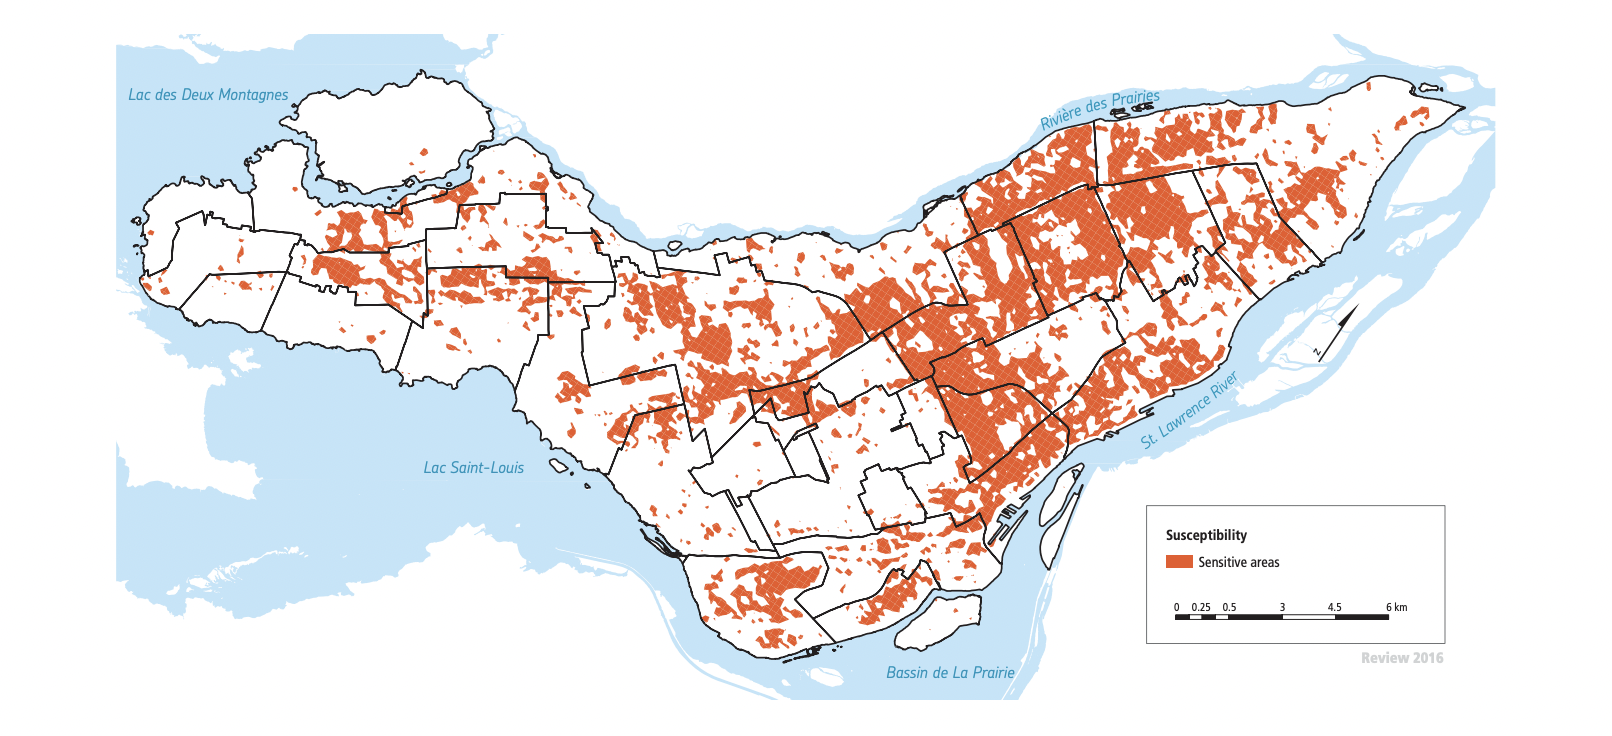
Figure 1 – Neighbourhoods in Montreal most affected by the urban heat island effect (Source)
Last summer, DDL research fellow Tuviere Onookome-Okome worked in collaboration with the Samuel Center for Social Connectedness to better quantify heat in the different neighborhoods of Montreal and validate how heat has previously been calculated in cities. A temperature monitoring campaign was conducted by the Weichenthal lab, based out of McGill University, as part of Tuviere’s Msc. in Epidemiology at McGill. Two hundred temperature monitors were mounted around the Island of Montreal to ensure good spatial coverage. This data was used with permission from the Weichenthal lab to explore the relationship between income levels and heat in different neighborhoods with a focus on Montreal, Canada.
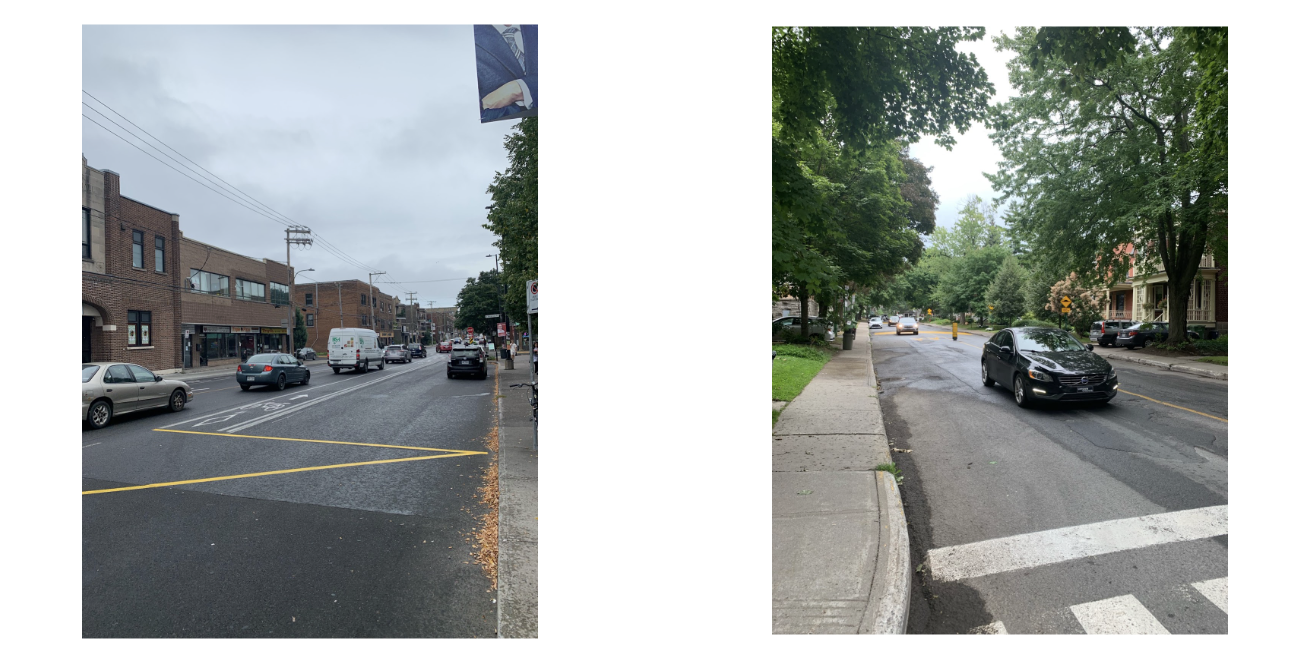
This research found that lower-income neighborhoods in comparison to higher-income in Montreal experience increased heat during the summer months, especially during heat waves. Lower-income areas such as the neighborhood of Verdun are more likely to have less tree coverage and more heat-conducting land-use variables like concrete and asphalt. The inherent built environments in lower-income areas in Montreal are not well-equipped for an increasingly hotter world.
Verdun (lower-income neighborhood) Mont- Royal (higher-income neighborhood)
Moreover, through our validation analysis, we found that temperature measurements from satellites are generally in agreement with ground-level sensor estimates. Collecting satellite-based temperature estimates is a low-cost option, and this study provides further proof that satellites can be an easy and reliable way to measure temperature.
Recommendations for addressing these issues include prioritizing lower-income neighborhoods in creating a new heat alert system and creating more green spaces. Actors could also reinvest in infrastructure that increases social networks during a heat wave, use satellite-based estimates of temperatures when designing heat mitigation plans, and launch citizen science initiatives where residents can collect their own temperature data for future research.
Increasingly, regular heat waves have become the norm in both the US and Canada. This trend exists within the broader backdrop of increased income inequalities. This report highlights the existing relationship between heat waves and income disparities, and in the years to come, this relationship will become more deeply-rooted and continue to disproportionately affect the most marginalized. The above recommendations provide a starting framework on how we can combat this problem right here in Montreal, and how we must go forward in better quantifying heat within all cities.
References:
- https://www.usatoday.com/story/news/nation/2022/07/24/northeast-heat-wave-records-deaths/10138863002/
- https://montreal.ctvnews.ca/multiple-heat-warnings-in-effect-in-quebec-thunderstorms-coming-1.5993301
- Hausfather Z. State of the climate: How the world warmed in 2019 | Carbon Brief [Internet]. Carbon Brief. 2020 [cited 14 August 2021]. Available from: https://www.carbonbrief.org/state-of-the-climate-how-the-world-warmed-in-2019
- Prairie Climate Center. Heat waves and health: A special report on climate change in Canada. Winnipeg: Prairie Climate Center; 2019 p. https://climateatlas.ca/heat-health-report.pdf.
- https://datadrivenlab.org/the-urban-heat-island-effect-in-montreal/
Recent Comments