by Andrew Feierman | Jun 14, 2018 | Climate, Presentations, Urban Environment and Social Inclusion Index
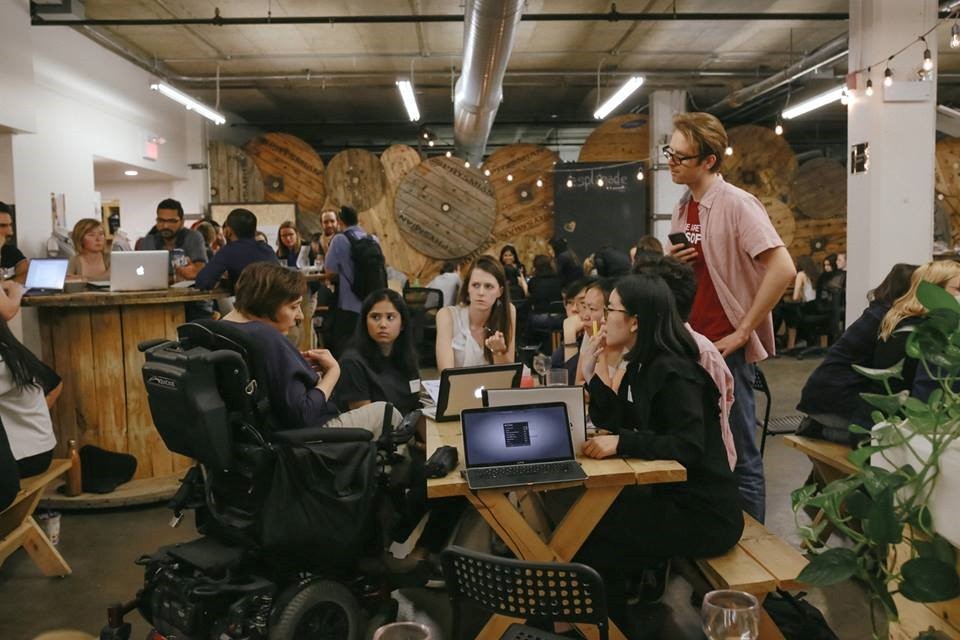
Article written by Valériane Buslot, Fellow for the Samuel Center for Social Connectedness Cross-posted on the Samuel Center website. On May 10th 2018, the Samuel Center for Social Connectedness (SCSC), Data-Driven Yale (DDY) and MTLGreen hosted “Measuring What...
by Amy Weinfurter | Feb 14, 2018 | Climate
It was, in the words of one attendee, “kind of an unusual mix.” Artists and graphic designers debated color choices with programmers, while musicians leaned over their laptops to consult with climate policy wonks. They all gathered this weekend, at the inaugural...
by Amy Weinfurter | Feb 5, 2018 | Climate
Climate change – an urgent, immediate problem – can sometimes feel like an abstract one. What do global temperature changes mean for a particular city and region? What will the difference between 1.5 and 2 C degrees of warming mean, in terms of heat waves, sea level...
by Data-Driven Lab | Dec 13, 2017 | Climate, UNFCCC
Representatives from 195 nations and roughly 20,000 delegates from across the world gathered over a fortnight in Bonn, Germany for the 23rd annual Conference of the Parties to the United Nations Framework Convention on Climate Change (COP-23), the next step for...
by Carlin Rosengarten | Oct 31, 2017 | Climate, Energy
The third annual 1 Gigaton Coalition report, “Renewable energy and energy efficiency in developing countries: contributions to reducing global emissions,” launched Oct.31 at a release event in Paris. This year’s report expands on two previous iterations, quantifying...
by Amy Weinfurter | Sep 19, 2017 | Climate, Data Visualization
This post and map were produced by Data-Driven Yale members Angel Hsu, Zev Nicolai-Scanio, Ross Rauber, Yihao Xie, Amy Weinfurter, Tina Huang, Geoffrey Martin, Ryan Thomas, Sophie Janaskie, Franz Hochstrasser, Sabrina Long, and Algol (Ziang) Li. On June 1 2017,...