Cities & Air Pollution Challenges
Air pollution is the leading environmental risk factor worldwide, killing around 4.2 million people per year. However, these 4.2 million people are far from randomly distributed. Those most vulnerable to air pollution are clustered by age, health, income levels, race and geographies. Access to a clean environment is fundamental to fostering inclusion and belonging within cities. What can cities do to tackle air pollution and social equity issues? Here I examine the distribution of urban residents’ exposure to air pollution and discuss ways to make air quality communication and public health information more accessible and inclusive. This builds on the work of the Urban Environment and Social Inclusion Index (UESI) which leverages high-resolution, large-scale data to reveal how cities perform at the intersection of environment and social equity.
lives are lost from air pollution every year
What is air pollution?
Where are pollution sources located?
Methodology
Dalhousie University’s Atmospheric Composition Analysis Group provides the satellite-derived PM2.5 and NO2 data. Air quality within each city’ administrative boundary is compared with the surrounding buffer area around each city of approximately the same area.
Cities more polluted
than immediate surroundings- Lima, Peru
- Chengdu, China
- Beijing/Tianjin, China
- Santiago, Chile
- Manila, Philippines

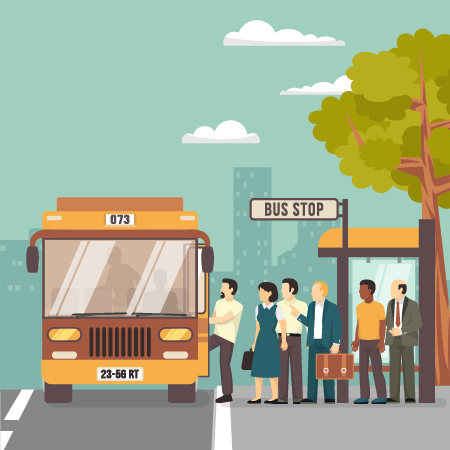
The Peruvian capital is one of the most polluted towns in Latin America, according to a study published in 2014 by the World Health Organisation (WHO). Over 5,000 people died as a result of this pollution between 2007 and 2011, and the chief cause of these deaths has been clearly identified. The CIES report highlights that 80 per cent are caused by Lima’s public transport. There is only one metro line and a second one under construction in this city of over nine million inhabitants. The most common means of transport are the “combis” minivans.
Surrounded by mountains to the East, air pollution from the heavy traffic of the city is trapped within Lima. The good news is that because we know where the pollution is coming from, the city has the agency to take measures that improve air quality. Lima faces geographic challenges to overcoming air pollutions. Meanwhile, other municipalities may have financial challenges or “locked-in” infrastructure to overcome. It is important to understand cities’ constrains and identify opportunities to improving urban air quality.

Cities less polluted
than immediate surroundings- Shanghai/Hangzhou, China
- Amsterdam, the Netherlands
- Maputo, Mozambique
- Yaounde, Cameroon
- Miami, USA
The air in Shanghai is far from healthy, but is relatively cleaner than its immediate surroundings. Shanghai is surrounded by other heavily industrialised and urbanised areas. To its north is Nantong, and to its West is Suzhou and Jiaxing. Shanghai is a heavily populated business hub, and as a result public transportation is the dominant mode of transport, while industries have been driven out beyond the city borders. In addition, westerly winds from the Pacific Ocean help to dissipate Shanghai’s air pollution further in-land.
While cleaner than its immediate surroundings, the levels of air pollution in Shanghai are still among the highest in the world. Shanghai will have to coordinate efforts with surrounding cities in order to achieve better air quality for the region as a whole. Global cities, with similar proximity to other urban or polluted areas should similarly take a regional approach to tackling air pollution.
Who is located in polluted areas?
Black and non-white neighbourhoods in the United States have higher exposure to particulate matter and other environmental hazards such as fracking waste and heat.

What can cities do?
Mitigation
Public transport
Investing in public transportation systems/pedestrian friendly cities
Green spaces
Creating buffer zones, particularly between roads or industrial areas and residential zones can reduce exposure to air pollution.
> “It’s impossible to escape from air pollution. You’re going to have to stop it at the source.” – Funda Gacal, Senior Consultant at the Health and Environment Alliance
Adaptation
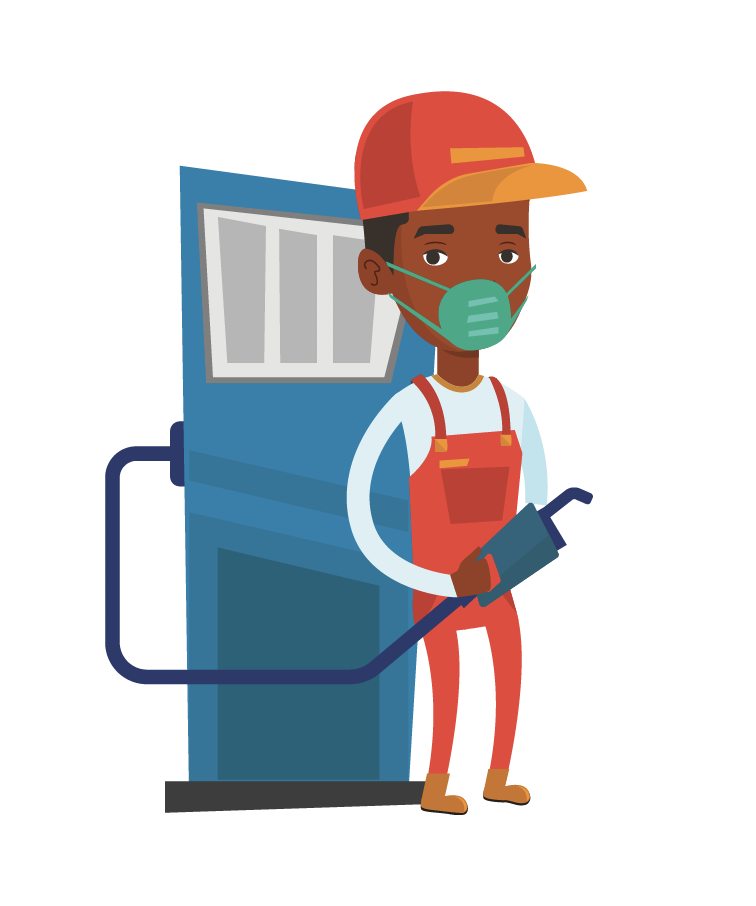 Protective gear for workers
Employers should provide their workers in construction sites, or those working close to high traffic areas, with N95 masks that can filter out fine particulate matter
Building standards
On average, we spend 90% of the day indoors. Improving building standards for air tightness can improve indoor air quality.
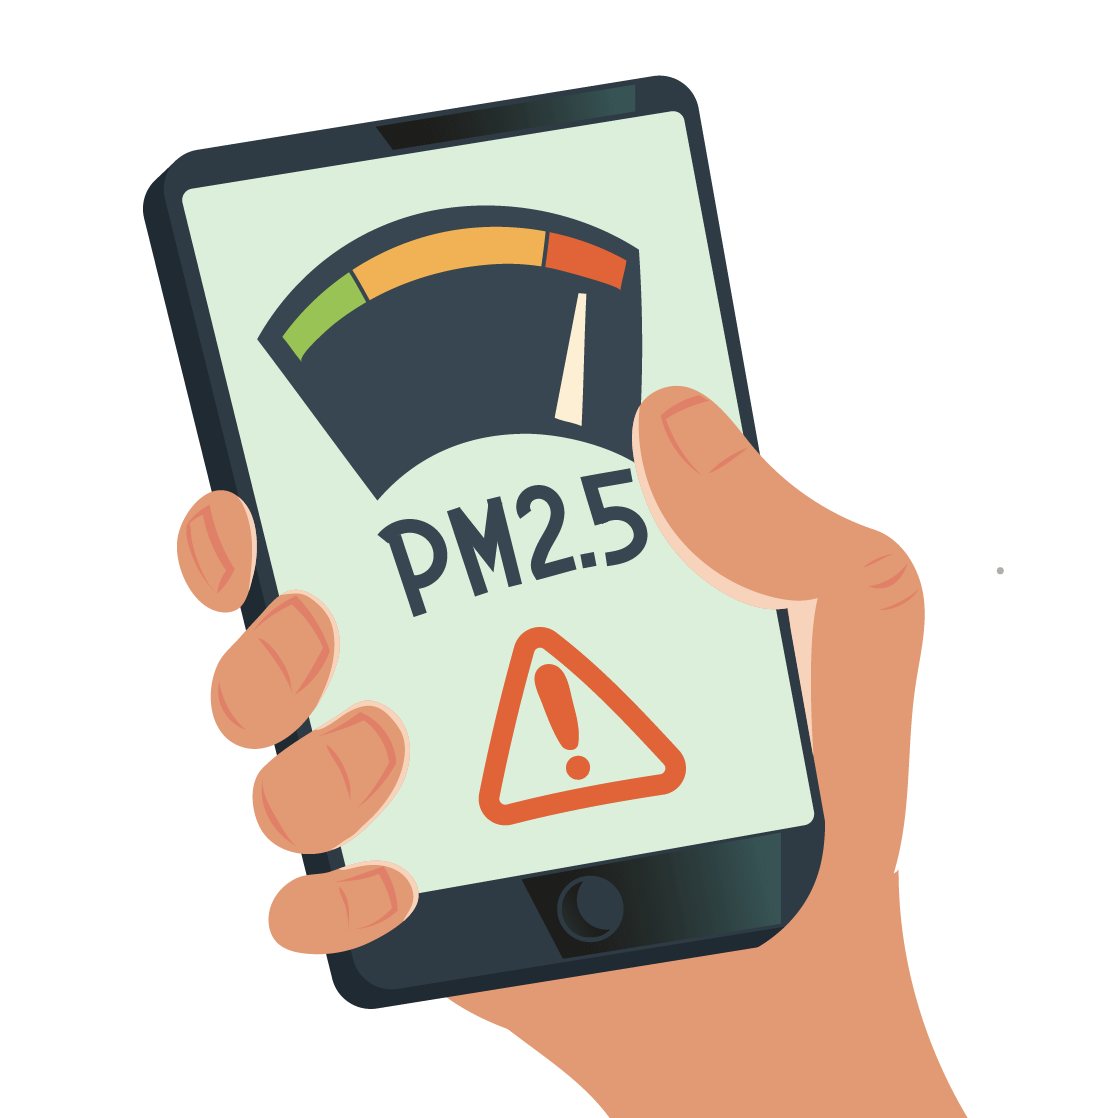
Alert systems
Warning systems when air pollution is high can alert school children, hospital patients and at-risk workers to stay indoors.
“For people that are vulnerable or sensitive to air pollution, having that data and knowing that it’s a good time to be staying indoors can drastically minimise their exposure – Jill Engel-Cox, Director of the National Renewable Energy Laboratory’s Joint Institute for Strategic Energy Analysis
Information
 Measuring
> “There is this really interesting disconnect between the way that air pollution has been measured in rich parts of the world and the way it’s never measured at all in poor parts of the world.” – Eben Cross, Founder of QuantAQ
Satellite versus ground observations: Even with improvements in global satellite databases of air quality, localised monitoring is imperative to safeguarding vulnerable populations. Eben Cross of QuantAQ explains, “The most relevant domain for measuring air pollution is the surface domain, and that’s the hardest thing to measure accurately from space.”
Communicating
Accessibility: Air quality information is often technical. Cities must make a conscious effort to translate data into easy to understand information. Additionally, for cities with diverse populations, it is important to create communication in the languages of populations most exposed to air pollution.
Standardising indicators: When cities create air quality indexes, they should not reinvent the wheel. Following the WHO’s air quality standards is the best way to decide whether the air quality is within a safe range. Any color coding of air quality data should be standardised with the WHO.
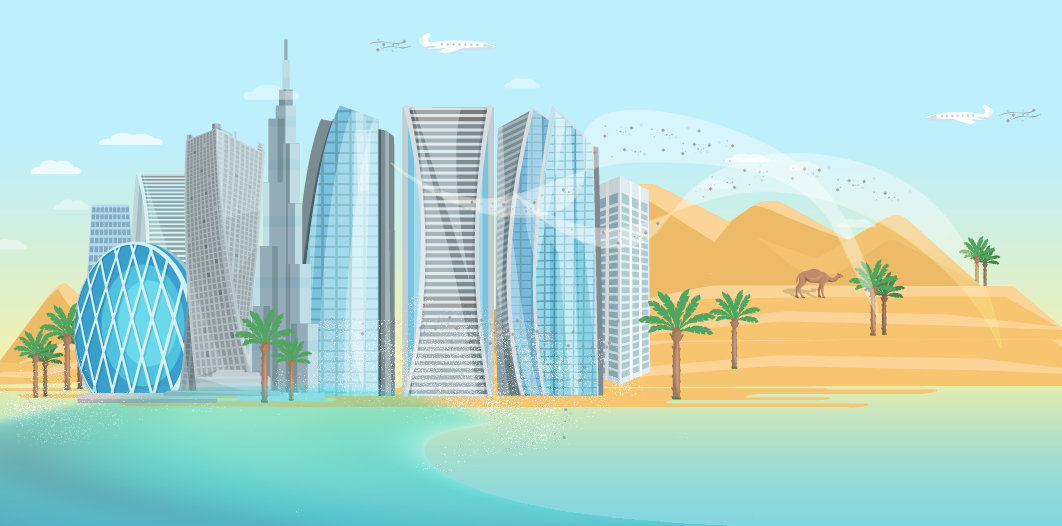
Case study from the UAE
The survey questionnaire collected ideas about the content and format in which residents prefer to receive public health information. This was used to develop a social media air quality information campaign, and inform the Environment Agency – Abu Dhabi’s long-term communication strategy.
Methodology
Format:
The vast majority of respondents (particularly aged above 24) preferred to use WhatsApp and Facebook for receiving information. At the same time, when asked what form of media they learn best from, the majority responded with “videos”.
Yet, it is worth noting that younger people indicated a preference towards Instagram and infographics. At the same time, Twitter users said that they learned from infographics more than videos. Therefore, when creating a communication strategy, it is worth asking who the audience is and what platforms the information will be disseminated through.
Overall the survey demonstrated that varying demographic groups are engaged by differing formats of information on different platforms. In order to reach groups most exposed to air pollution, we must have a clear idea about who these people are and how to effectively communicate with them. There is no one-size-fits-all communication method for air quality.
- Articles 14.3%
- Images 10.2%
- Infographics 27.6%
- Videos 48.0%
- WhatsApp 31.4%
- Facebook 27.4%
- Twitter 7.2%
- Instagram 14.3%
- Email 18.0%
 Content:
The content that respondents were most interested to learn more about was:
- How to protect yourself from air pollution
- Health impacts of air quality
- Environmental impacts of air quality
They were less interested in the causes of air pollution and its social or economic impacts. Therefore, communication may be more effective in the form of tangible content that focuses on the practical implications and strategies to safeguard ourselves from air pollution.
An air quality communication video, guided by the survey results, can be viewed below.
By Hannah Melville-Rea, Social Connectedness Fellow 2020, Samuel Centre for Social Connectedness
The Social Connectedness Fellowship is a program for early career scholars to develop research specific to their partner’s objectives and to social connectedness. SC Fellows conduct outreach, research, writing, and analysis on their topic while engaging with the local community.