City
Shanghai
Equity curves
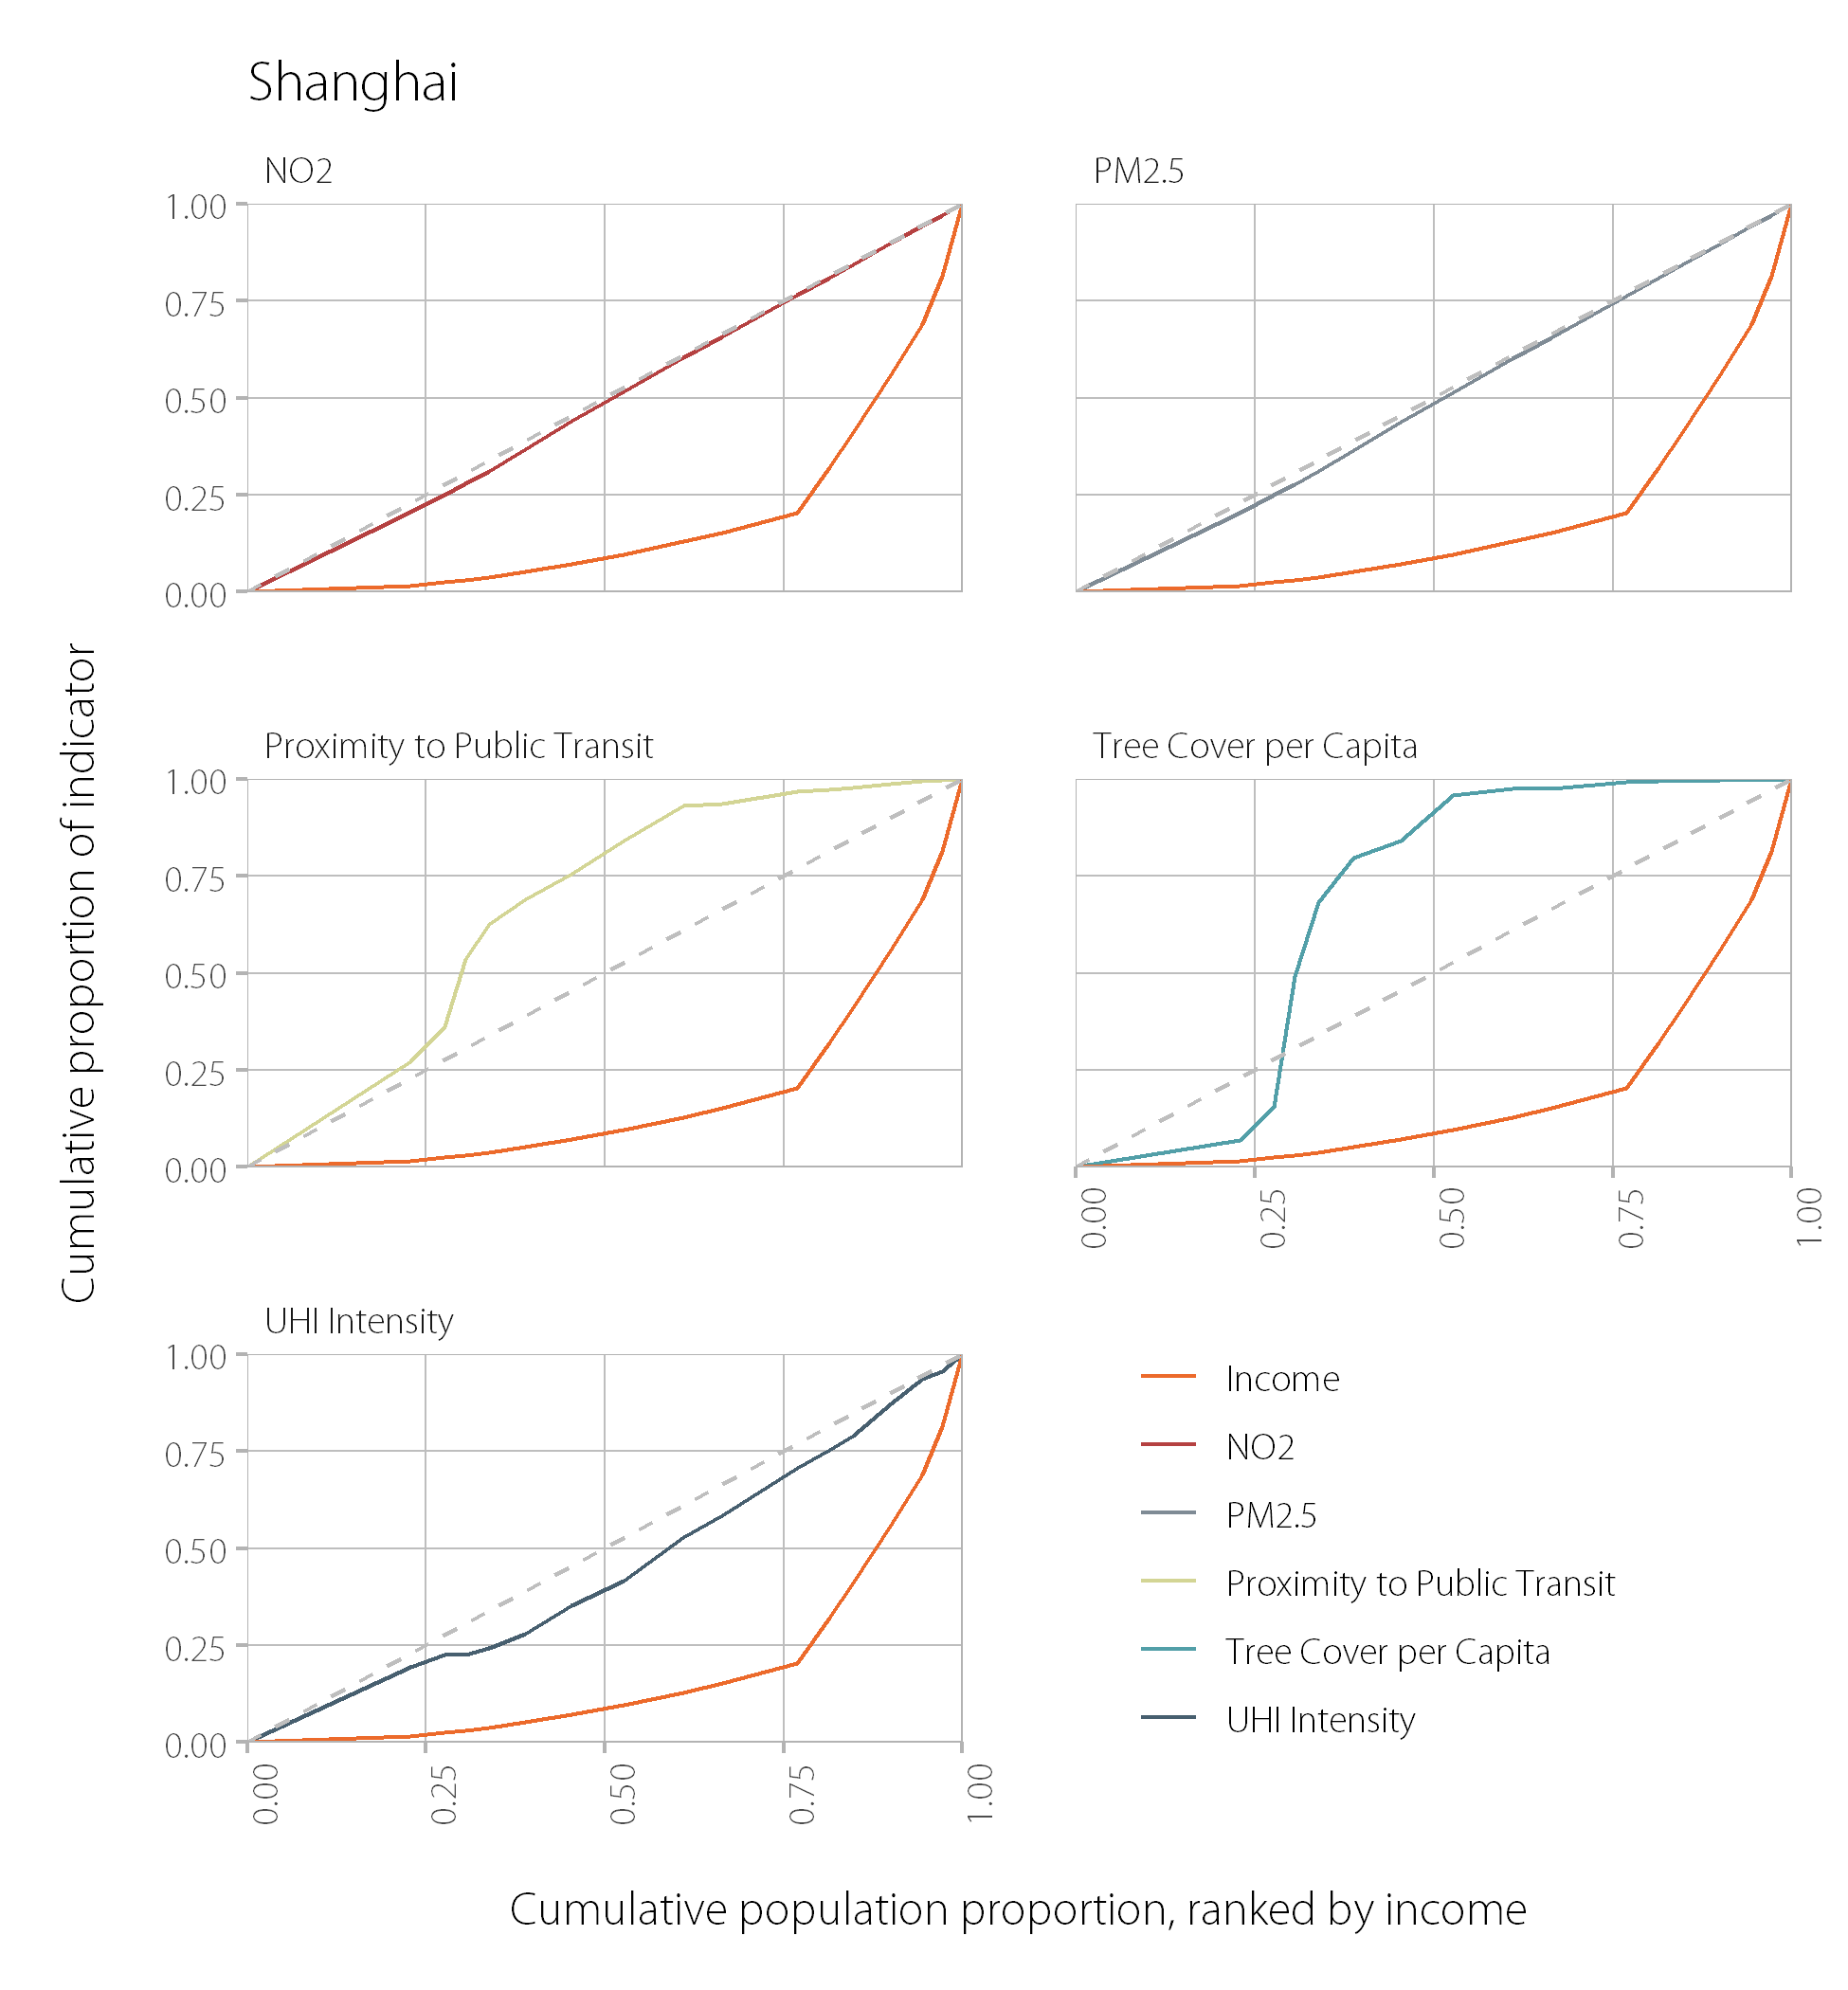
Below the x-axis refers to the cumulative proportion of a city’s population – ranked by income – and the y-axis is the cumulative proportion of income or environmental outcome distributed throughout the city for the Income Lorenz Curve and the Environmental Concentration Curve respectively. A 45-degree line represents perfect distributive equity. If the Environmental Concentration Curve is fully located above the line of perfect equity, it indicates that the environmental outcome is more heavily allocated to those with less income; below the line of perfect equity means the environmental outcome is more heavily allocated to those with more income.
Typology plot
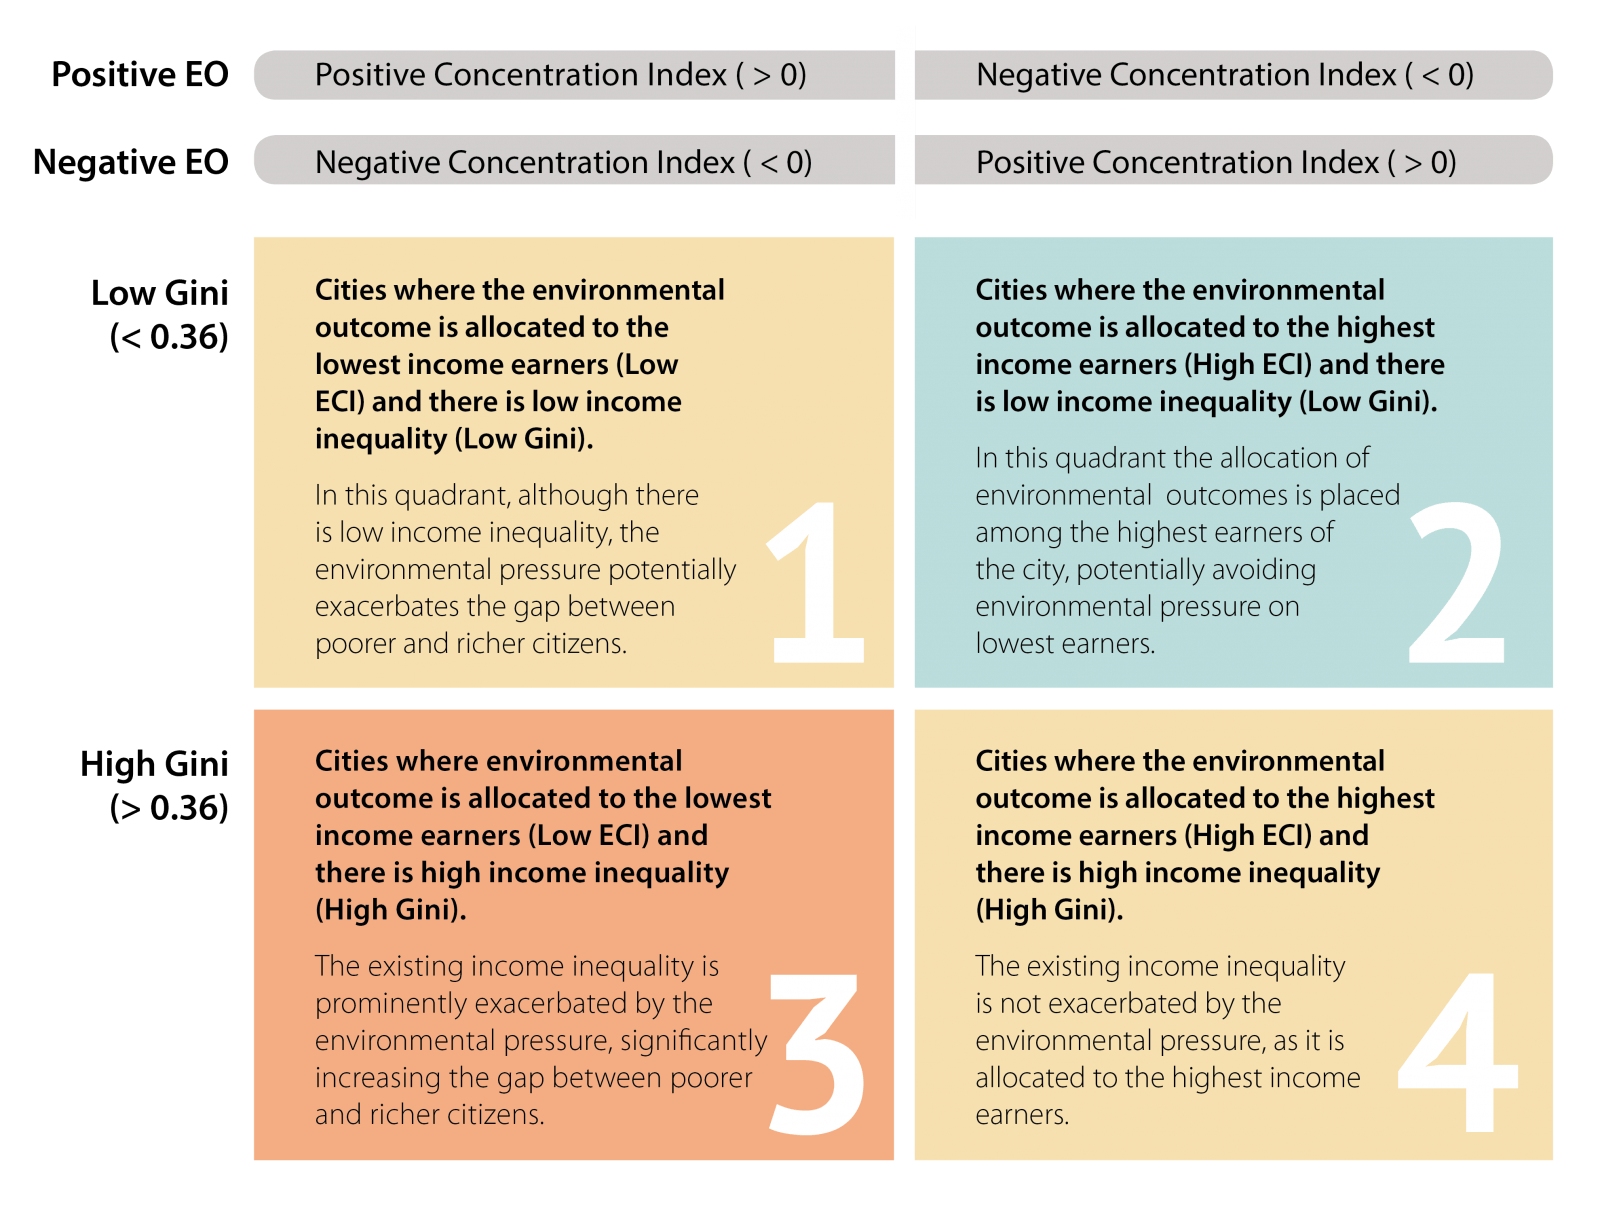
The typology’s four quadrants are defined based on two axes. The x-axis denotes the Environmental Concentration Index of a variable and the y-axis denotes the income inequality, as expressed through the Gini coefficient. The UESI uses a Gini coefficient value of 0.36 and an ECI value of 0 to separate the quadrants.