Issue Profile
Urban Tree Cover
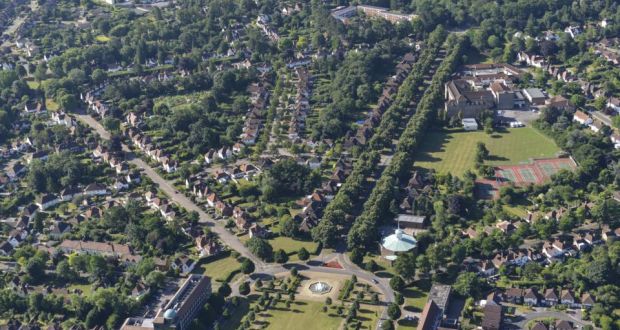
Tree Cover and Green Space provide a number of environmental benefits to urban residents, including shade and evaporative cooling, as well as providing habitat for biodiversity.
Chapter Authors
Diego Manya
Yihao Xie
Genevieve Westgate
The Urban Tree Cover indicator measures the presence of tree cover within a city. This indicator also acts as a proxy for a city’s green space — the physical presence of vegetation — within city neighborhoods. The Urban Tree Cover/Green Space issue category includes two indicators: Tree Canopy Cover Loss and Tree Cover Per Capita.
The Tree Canopy Cover Loss indicator describes the total area (in square kilometers) of urban tree loss from 2001 to 2016, benchmarked against the tree cover baseline extent in 2000. As defined by Hansen et al. (2013)1 Hansen, M. C., P. V. Potapov, R. Moore, M. Hancher, S. A. Turubanova, A. Tyukavina, D. Thau, S. V. Stehman, S. J. Goetz, T. R. Loveland, A. Kommareddy, A. Egorov, L. Chini, C. O. Justice, and J. R. G. Townshend. (2013). , tree cover loss is a stand-replacement disturbance, or a change from a forest to non-forest state, such as the removal or death of trees, regardless of the cause and inclusive of all types of tree cover.
The second indicator, Tree Cover Per Capita, assesses a population’s access to its urban forest, measuring the tree cover extent per person living in the defined area of analysis. A variation of this indicator, Tree Cover per Capita Deficit, is also calculated, and defined as the additional square meters of tree cover needed to reach the UN-Habitat’s suggested 15 square meters (m2) of tree cover per capita.
Green spaces and tree cover, as part of Open Public Spaces, are a critical component of a thriving urban environment, with the potential to provide economic, social and environmental benefits to a city, and improve the livelihoods of its citizens. These benefits are well-documented in the academic literature (Escobedo et. al. 20112 Escobedo, F. J., Kroeger, T., & Wagner, J. E. (2011). Urban forests and pollution mitigation: analyzing ecosystem services and disservices. Environmental pollution, 159(8), 2078-2087. , Dobbs et.al. 20113 Dobbs, C., Escobedo, F. J., & Zipperer, W. C. (2011). A framework for developing urban forest ecosystem services and goods indicators. Landscape and urban planning, 99(3), 196-206. ) and include:
- Regulation and reduction of air pollution4 Nowak, D. J., Crane, D. E., & Stevens, J. C. (2006). Air pollution removal by urban trees and shrubs in the United States. Urban forestry & urban greening, 4(3), 115-123. 5 Yang, J., McBride, J., Zhou, J., & Sun, Z. (2005). The urban forest in Beijing and its role in air pollution reduction. Urban Forestry & Urban Greening, 3(2), 65-78.
- Improvement of stormwater infiltration6 Bartens, J., Day, S. D., Harris, J. R., Dove, J. E., & Wynn, T. M. (2008). Can urban tree roots improve infiltration through compacted subsoils for stormwater management?. Journal of Environmental Quality, 37(6), 2048-2057. and reduction of surface water runoff7 Zhang, B., Xie, G., Zhang, C., & Zhang, J. (2012). The economic benefits of rainwater-runoff reduction by urban green spaces: A case study in Beijing, China. Journal of environmental management, 100, 65-71.
- Regulation of the urban heat island effect8 Taha, H. (1997). Urban climates and heat islands: albedo, evapotranspiration, and anthropogenic heat. Energy and buildings, 25(2), 99-103., resulting in a decrease in energy used for cooling purposes9 Akbari, H., Pomerantz, M., & Taha, H. (2001). Cool surfaces and shade trees to reduce energy use and improve air quality in urban areas. Solar energy, 70(3), 295-310.
- Conservation of wildlife refuge and habitat10 Dwyer, J. F., McPherson, E. G., Schroeder, H. W., & Rowntree, R. A. (1992). Assessing the benefits and costs of the urban forest. Journal of Arboriculture, 18, 227-227.
- Increased physical and mental health11Lee, A. C., & Maheswaran, R. (2011). The health benefits of urban green spaces: a review of the evidence. Journal of public health, 33(2), 212-222.
- Potential economic development12Wolf, K. L. (2005). Business district streetscapes, trees, and consumer response. Journal of Forestry, 103(8), 396-400. and increased property values in areas13Laverne, R. J., & Winson-Geideman, K. (2003). The influence of trees and landscaping on rental rates at office buildings. Journal of Arboriculture, 29(5), 281-290. and business with improved streetscapes and proximity to urban forests
- Community empowerment and social cohesion, both actively, through the process of greening the community, and passively, from the use of the green spaces.14[Westphal, L. M. (2003). Urban greening and social benefits: a study of empowerment outcomes. Journal of Arboriculture, 29(3), 137-147.
As a result of the increasing understanding of the benefits of urban green spaces, many cities have included green space as a component for the evaluation and management of sustainable urban centers. These initiatives use several methods to evaluate of green space – ranging from remote sensing imagery to administrative data of parks and tree inventories – that allow decision makers to evaluate trends over time. This data can also track the general population’s access to urban green spaces, which can inform both citywide and very local strategies.
Access to green space is a key aspect of urban sustainability. A disproportionate lack of access to green spaces in relation to social factors, such as income and ethnicity, has also been highlighted as a particularly relevant aspect of environmental equity.15Wolch, J. R., Byrne, J., & Newell, J. P. (2014). Urban green space, public health, and environmental justice: The challenge of making cities ‘just green enough’. Landscape and Urban Planning, 125, 234-244. 16Ngom, R., Gosselin, P., & Blais, C. (2016). Reduction of disparities in access to green spaces: Their geographic insertion and recreational functions matter. Applied Geography, 66, 35-51. Providing public services and access to infrastructure can reduce income inequality, and has a stronger redistributive effect among specific groups at higher risk of poverty (OECD 2011)17OECD (2011), “The Distributive Impact of Publicly Provided Services”, in Divided We Stand: Why Inequality Keeps Rising, OECD Publishing, Paris. http://dx.doi.org/10.1787/9789264119536-12-en, particularly because the poor have less access to private substitutes for these services (Calderon and Server, 2014)18Calderón, C., & Servén, L. (2014). Infrastructure, growth, and inequality: an overview.. Given the links between environmental health risks and poverty (UNEP, UNDP 2011)19UNDP-UNEP Poverty-Environment Initiative. (2011). Mainstreaming climate change adaptation into development planning: a guide for practitioners. Poverty-Environment Initiative (PEI), a joint programme of the United Nations Development Programme (UNDP) and the United Nations Environment Programme (UNEP), UNDP-UNEP Poverty-Environment Facility, Nairobi, Kenya., and the economic and social benefits associated with green space, access to inclusive and safe green spaces is one way to reduce inequalities within urban areas. Sustainable Development Goal (SDG) 11 includes a target (11.7) that aims to provide universal access to safe, inclusive, and accessible green and open spaces, as measured through the proportion of open space – including green space – for public use in cities’ built-up areas.
The data for both indicators is derived from the Global Forest Change 2001–2016 (Hansen et al. 2013) dataset20Global Forest Change 2000–2016 v1.4. Retrieved from: https://earthenginepartners.appspot.com/science-2013-global-forest/download_v1.4.html. Three main layers of the dataset – Baseline, Loss and Gain – were used for the extraction of the tree cover values, and additional socioeconomic and spatial information was used for the calculation of the indicators. Although the Hansen et al. (2013) satellite-derived gain numbers have been criticized for their inaccuracy at higher latitudes (Tropek et al., 2014)21Tropek, R., Sedláček, O., Beck, J., Keil, P., Musilová, Z., Šímová, I., & Storch, D. (2014). Comment on “High-resolution global maps of 21st-century forest cover change”. Science, 344(6187), 981-981. and the authors themselves caution against developing a net number by subtracting gain numbers from tree cover loss, we utilize the gain data to correct for issues – such as negative tree cover presence – in the time series for some urban areas at a very small scale, a problem that is not usually found when the data is used exclusively for the analysis of forests.
The target for Urban Tree Canopy Cover Loss is zero, indicating that the city has not lost any Tree Canopy Cover between 2001 and 2016. While this target might be suitable for established cities, many growing cities – particularly in the developing world – might have some tree cover loss due to the conversion of vegetated, undeveloped land to a built environment. This shift is not necessarily a reflection of inadequate management or a disregard for green spaces, but a result of the city’s growth.
The target for Tree Cover Per Capita is 15 square meters (m2) of tree cover per capita, a target we adopt from the UN-Habitat’s calculation of their City Prosperity Index.22City Prosperity Index Metadata 2016. Retrieved from: http://cpi.unhabitat.org/cpi-information.
Description
History of identifying and monitoring urban green space
Green spaces and parks have been a feature of cities since ancient times. Beginning in the late 19th century, many urban planning schools and approaches sought to capture their role and relevance for cities. The Garden City Movement23Grant J.L. (2014). Garden City Movement. In: Michalos A.C. (eds) Encyclopedia of Quality of Life and Well-Being Research. Springer, Dordrecht, founded in 1898 by Ebenezer Howard in the United Kingdom, proposed the development of limited-size cities, with proportionate areas for housing, industry, and agriculture, surrounded by rural green belts. The City Beautiful Movement, developed in the US since 1893, promotes the beautification of cities using, among other features, parks and green spaces24Ozuduru B.H. (2014). City Beautiful Movement. In: Michalos A.C. (eds) Encyclopedia of Quality of Life and Well-Being Research. Springer, Dordrecht. The New Urbanism movement gained prominence in the 1990s. Its main components include the strong need for public space, of which public green space is a key element25Talen E. (2014). New Urbanism. In: Michalos A.C. (eds) Encyclopedia of Quality of Life and Well-Being Research. Springer, Dordrecht. The Sustainable Communities Movement has also grown since it founding in the mid-1990’s – it aims to bring the concept of sustainability to the urban context, and highlights the use of green spaces to address many urban challenges26Tomalty R. (2014). Sustainable Communities Movement. In: Michalos A.C. (eds) Encyclopedia of Quality of Life and Well-Being Research. Springer, Dordrecht.
All of these movements, with their respective approaches and limitations, aim to improve citizens’ quality of life, often in response to poor conditions in urban centers, and include green space as an important tool to achieve this goal. Most recently, the adoption of the Sustainable Development Goals (SDGs), particularly SDG 11, and the New Urban Agenda (NUA) — which includes the explicit objective of achieving equitable access to green spaces for all citizens — demonstrate the increasing recognition of urban green spaces’ importance in making urban centers more sustainable.
Given the benefits it provides, the identification and monitoring of urban vegetation has been explored through different techniques, primarily through remote sensing imagery or survey-based data27Seiferling, I., Naik, N., Ratti, C., & Proulx, R. (2017). Green streets− Quantifying and mapping urban trees with street-level imagery and computer vision. Landscape and Urban Planning, 165, 93-101.. Remote-sensed imagery has been used extensively in studies that aim to relate land use patterns with other spatial features, such as land temperature or air pollution. Survey-derived data, such as administrative inventories of green spaces, have been used in studies exploring issues around access to green spaces and the equitable distribution of green spaces in a city. Recently, new approaches have leveraged additional datasets to measure green space. The Treepedia project28Li, X., Zhang, C., Li, W., Ricard, R., Meng, Q., & Zhang, W. (2015). Assessing street-level urban greenery using Google Street View and a modified green view index. Urban Forestry & Urban Greening, 14(3), 675-685., for instance, uses street-photographs to measure the greenness of a city (see Box 2 for additional details about the Treepedia project). Box 1, Complementary measures of greenness in urban spaces, highlights the relationship between satellite-derived measures of urban tree canopy and additional sources of information, such as administrative data about parks and street trees within a city.
Box 1. The complementary measures of greenness in urban spaces.
The most common approaches to analyzing of urban vegetation involve either remote sensing imagery, data derived from field surveys, or a combination of both. While these approaches aim to measure a city’s greenness, due to limitations in their nature and methods, none can completely measure all its elements, and the results of different indicators for the same city could be significantly different.
To explore these differences, the following graphs compare three different indicators that measure the green space for the city of Sao Paulo using different approaches. The first indicator, TREECAP, represents the total amount of Tree Cover per person, measured from the Global Forest Change Dataset (Hansen et. al. 2013), and is an example of a satellite-derived indicator. The other two indicators examine the green space of a city using primarily survey-based data. The PARKCAP indicator represents the total amount of official park area per person, measured using the city of Sao Paulo’s official public park repository. The STREECAP indicator measures the number of street trees per person, according to the city’s street database.
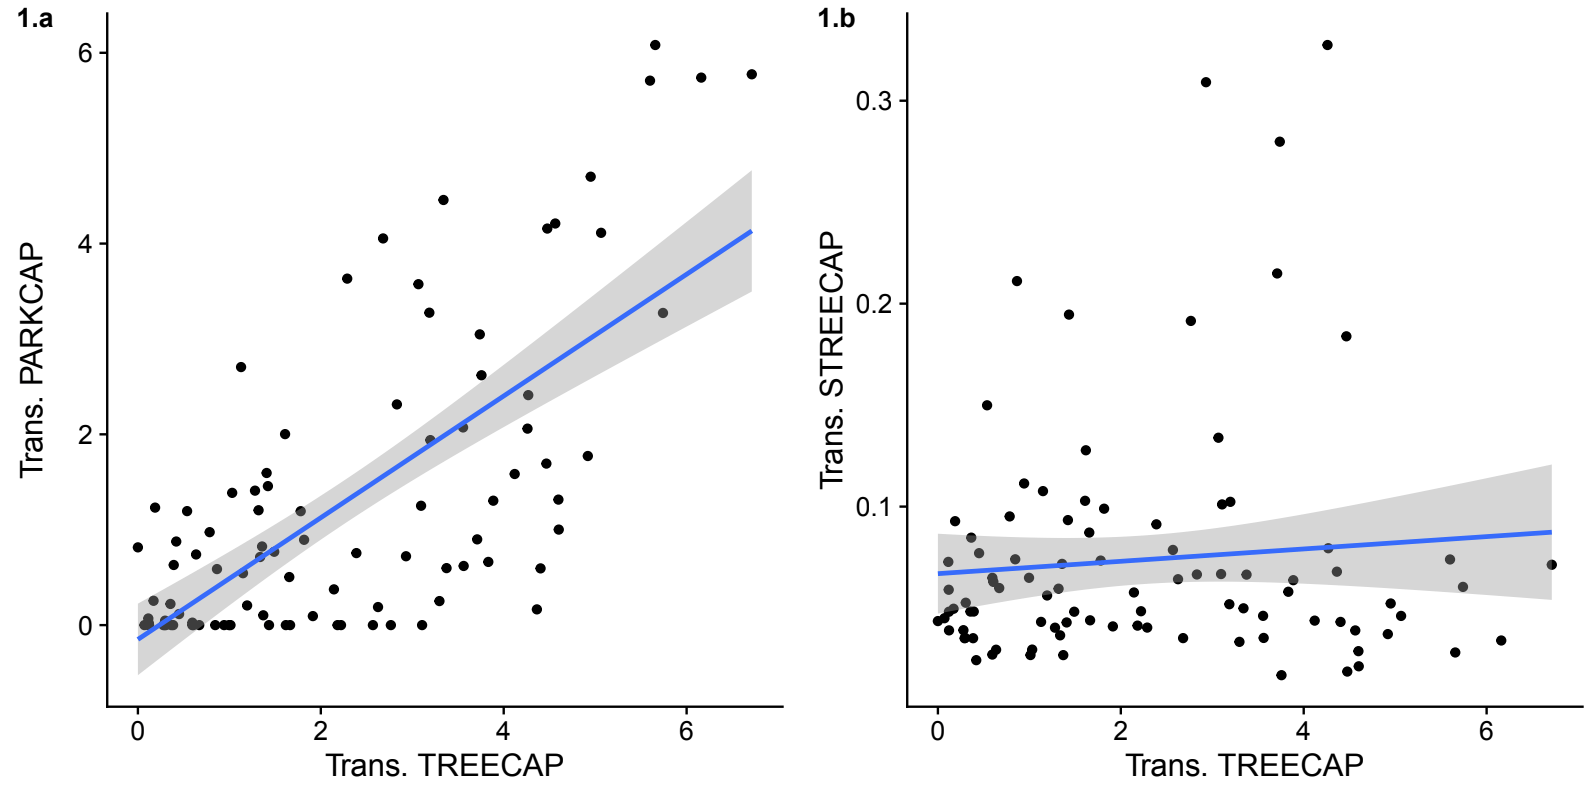
Figure 1. Graphical association of indicators of Green Space for the city of Sao Paulo
A visualization of the relationship between these three indicators illustrates their complementary nature. Figure 1 shows scatterplots of the three transformed indicators, compared in a pairwise form, including a trend line of their relationships. Figure 1.a shows that the TREECAP and PARKCAP indicators are positively associated. In other words, the provision of tree canopy cover per person is positively associated with the provision of urban parks in the city of Sao Paulo. While this might seem like a very logical relation, its important to consider that the presence of Tree Cover is not exclusive to urban parks, and in fact some urban parks, like plazas or monumental spaces, might not provide tree cover at all.
Another potential source of difference between the TREECAP and PARKCAP indicators is related to the specific elements that they are able to measure. For instance, while the tree cover indicator provides a broad indication of the presence of areas with accumulated tree canopy in cities, it cannot distinguish between the public and private spaces where this vegetation is located, a key aspect when access and equity is considered. Figure 2 exemplifies this issue, illustrating that much of the city’s tree cover occurs outside official parks, in what could be private areas, or vegetated undeveloped land.
In other cases, indicators are less closely aligned. In Figure 1.b, which compares the TREECAP and the STREECAP indicators, the association between the two is almost non-existent, suggesting that the indicators measure very different aspects of the urban vegetation, due to the nature of their methods. Whereas TREECAP is able to identify and measure areas of tree cover as small as 90m2, STREECAP is able to measure individual trees and linear green spaces at a much more granular level. This difference highlights the need to fully understand the nature of the indicators that are being used and which component of a city’s greenness is being measured.
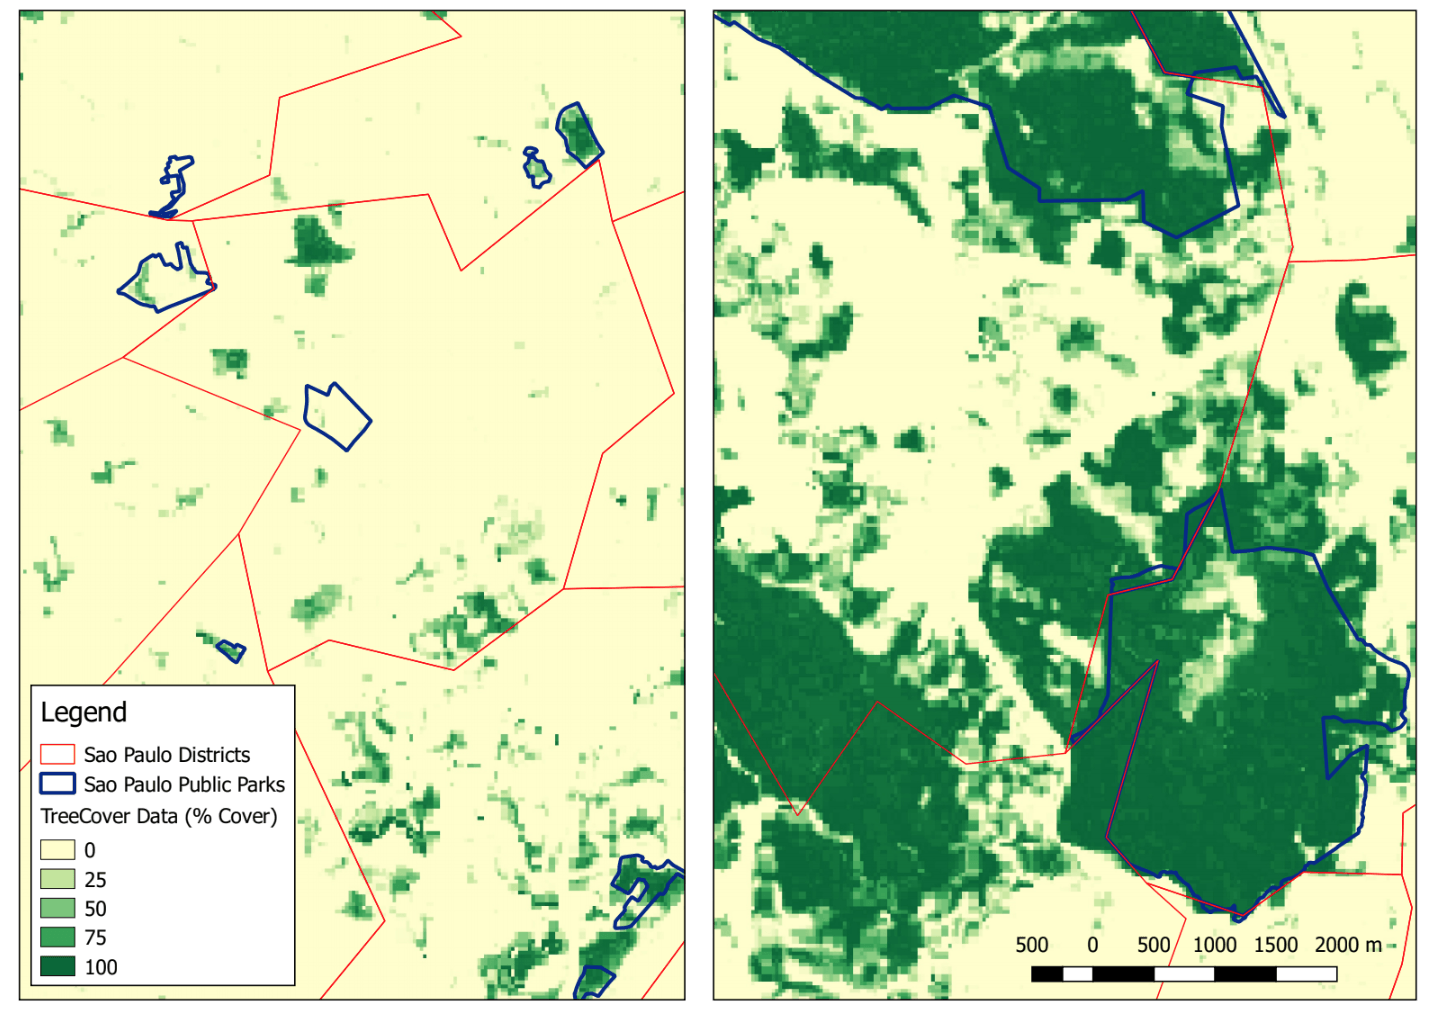
Figure 2. Map of tree cover as it relates to public parks in Sao Paulo.
In summary, even though the UESI uses a remote sensing approach to measure green spaces, a more comprehensive analysis of urban vegetation should involve the use of multiple complementary measures. The use of large-scale remote sensing datasets should be complemented with administrative records of the managed parks and vegetation, in order to provide complete information about the state of a city’s vegetation. Unfortunately, this integration faces several barriers, especially in developing countries, where access to remote sensing imagery and the construction of local repositories both entail additional costs and human capacity. Attention to new methods and databases that can generate these indicators – such as the Global Forest Change Dataset29Hansen, M. C., P. V. Potapov, R. Moore, M. Hancher, S. A. Turubanova, A. Tyukavina, D. Thau, S. V. Stehman, S. J. Goetz, T. R. Loveland, A. Kommareddy, A. Egorov, L. Chini, C. O. Justice, and J. R. G. Townshend. (2013). Global Forest Change Dataset., or the Treepedia project from MIT-Senseable Lab (see Box 2 for more details on this project) – could help overcome some of the existing barriers for obtaining quality and policy relevant data.
Box 2. Treepedia Case Study
A recent project from the MIT Senseable Lab fills an important data gap about green space in urban environments. Its Treepedia Project uses a multi-step computer vision algorithm to quantify the percent of tree cover along city streets. The algorithm leverages streetscape images from Google Street View to quantify and create a measure of a city’s greenness, in their Green View Index30Seiferling, I., Naik, N., Ratti, C., & Proulx, R. (2017). Green streets− Quantifying and mapping urban trees with street-level imagery and computer vision. Landscape and Urban Planning, 165, 93-101.. The project creates a source of data that academics, practitioners and decision-makers can use to evaluate the state of the urban vegetation from a citizen’s perspective. In fact, the Treepedia project has purposefully centered on streetscapes, and not on large parks, in the hopes of raising awareness about a less explored but very relevant component of green space in cities.
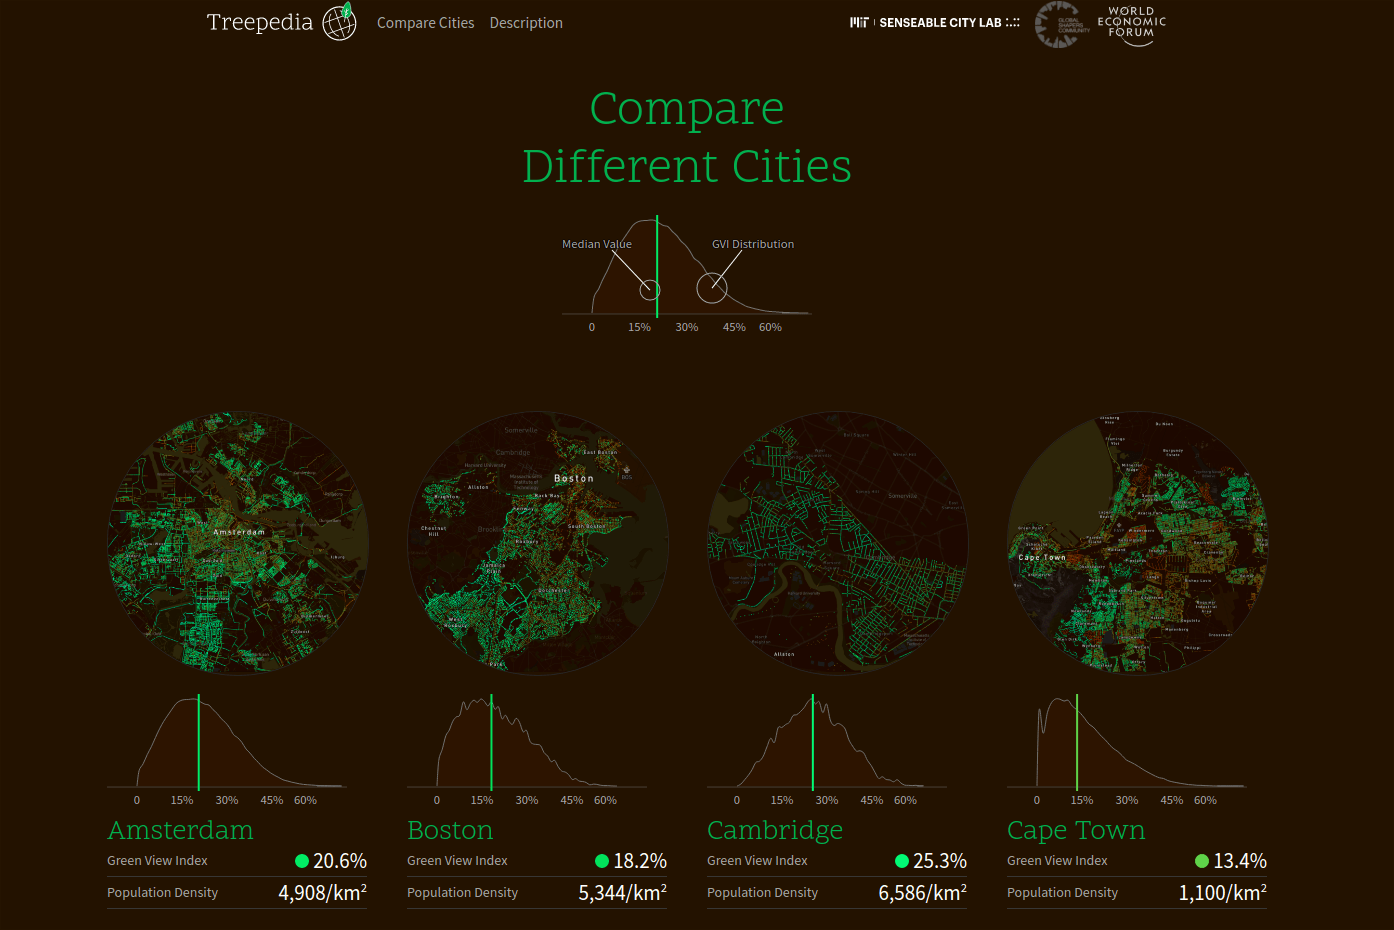
Figure 3. Results of Treepedia’s Green View Index for the cities of New York, Paris, London and Los Angeles. Available at: http://senseable.mit.edu/treepedia.
The Green View Index has been calculated for 27 cities, including many UESI cities, such as Amsterdam, Johannesburg, London, Los Angeles, New York, Paris, Sao Paulo, Singapore, and Vancouver, as shown in Figure 3. Unfortunately, a straightforward comparison of the Green View Index and the UESI green space indicators would not be accurate, due to the need to reconcile the boundaries of analysis and the different levels of data aggregation – currently the Treepedia project only has information at a city-level. Future iterations of the Green View Index might allow for a more disaggregated calculation that would then enable neighborhood-level comparisons, and a deeper understanding on the state and types of vegetation within urban landscapes.
Like all measures of urban greenness, the Green View Index should be interpreted with some caveats in mind. In addition to some limitations associated with the method itself, two considerations are particularly relevant. The first is that the Index is limited strictly to streetscapes and available only for cities that have consistent street-level imagery captured by Google Street View, which could limit its use for some cities in developing countries. Additionally, like most remote sensing approaches, the Index is not able to distinguish between the private and public provision of greenness within a city. In other words, the Index does not shed light on how equitable or accessible green space is to a city’s citizens. However, even with its limitations, the Index provides an important and complementary measure of the greenness of a city, particularly as it highlights the experience that the citizens can have of the urban landscape31Seiferling, I., Naik, N., Ratti, C., & Proulx, R. (2017). Green streets− Quantifying and mapping urban trees with street-level imagery and computer vision. Landscape and Urban Planning, 165, 93-101.
In addition to exploring methods to identify and quantify urban green spaces, researchers have attempted to analyze how different forms of urban green space impact the city environment and urban citizens. Ekkel and Vries suggest that it is quite common for health-related studies to only consider green spaces above a minimum size32Ekkel, E. D., & de Vries, S. (2017). Nearby green space and human health: Evaluating accessibility metrics. Landscape and Urban Planning, 157, 214-220.. Positive associations between green space and residents’ well-being have been found in studies that focus on green spaces of at least 500 square meters (m2)33Krekel, C., Kolbe, J., & Wüstemann, H. (2016). The greener, the happier? The effect of urban land use on residential well-being. Ecological economics, 121, 117-127.. However, the role of small and consistent green spaces – such as street trees – cannot be discarded, as other studies have also found positive associations between these streetscapes and health indicators34Van Dillen, S. M., de Vries, S., Groenewegen, P. P., & Spreeuwenberg, P. (2012). Greenspace in urban neighbourhoods and residents’ health: adding quality to quantity. J Epidemiol Community Health, 66(6), e8-e8..
Recent papers have also explored the relationship between different types of green spaces and urban heat island (UHI) mitigation. Xi and Ratti (2008) applied innovative techniques using Google street-view images as a way to measure the shade and cooling benefits of urban street trees in Boston35 Li, X., & Ratti, C. (2018). Mapping the spatial distribution of shade provision of street trees in Boston using Google Street View panoramas. Urban Forestry & Urban Greening, 31, 109-119.. Park et al. found that linear green spaces – lines of vegetation planted in one or two rows – appear to have no significant relationship on UHI reduction, while polygonal green spaces of at least 300 square meters, with 2300 cubic meters of vegetation cover volume, could reduce UHI by 1ºC in their study area36Park, J., Kim, J. H., Lee, D. K., Park, C. Y., & Jeong, S. G. (2017). The influence of small green space type and structure at the street level on urban heat island mitigation. Urban Forestry & Urban Greening, 21, 203-212.. Yang et al. also found that the composition and configuration of green spaces affected the distribution of land surface temperature, though this effect varied across different seasons, and with the size and shape of urban green spaces, among other factors37Yang, C., He, X., Wang, R., Yan, F., Yu, L., Bu, K., … & Zhang, S. (2017). The Effect of Urban Green Spaces on the Urban Thermal Environment and Its Seasonal Variations. Forests, 8(5), 153..
Other studies analyze the role of different types of vegetation configurations play in providing the benefits of green space. A study by Shashua-Bar et al. suggests that tree shade reduces thermal stress more than grass alone38Shashua‐Bar, L., Pearlmutter, D., & Erell, E. (2011). The influence of trees and grass on outdoor thermal comfort in a hot‐arid environment. International Journal of Climatology, 31(10), 1498-1506.. Considering the water needed to maintain different types of vegetation – grass has a greater demand for water than trees, for instance – shade trees reduced thermal stress more efficiently than the combination of trees and grass, or grass alone. Similarly, a study of green spaces on roofs (or green roofs) by Yang et al. found that trees remove more air pollutants than short grass or tall herbaceous plants39Yang, J., Yu, Q., & Gong, P. (2008). Quantifying air pollution removal by green roofs in Chicago. Atmospheric environment, 42(31), 7266-7273..
The UESI draws its Tree Cover indicators from the Global Forest Change 2001–2016 (Hansen et. al. 2013) dataset40Global Forest Change 2000–2016 v1.4. Retrieved from: https://earthenginepartners.appspot.com/science-2013-global-forest/download_v1.4.html.. While originally developed as a tool for large landscape observation, this dataset provides a meaningful and refined analysis of green spaces. It measures the presence of trees at least 5 meters tall, in line with some studies that suggest that trees provide additional benefits than other forms of vegetation, such as grass or shrubbery. Other studies (Wang, 1998; Iverson and Cook, 2000)41Wang, S. C. (1988). An analysis of urban tree communities using Landsat Thematic Mapper data. Landscape and urban planning, 15(1-2), 11-22.42Iverson, L. R., & Cook, E. A. (2000). Urban forest cover of the Chicago region and its relation to household density and income. Urban Ecosystems, 4(2), 105-124. have also utilized large-scale data — in these examples, Landsat data — to measure urban tree cover. The specific indicators calculated for this issue area aim to represent both the evolution in the presence of tree cover in a city over the last 15 years (Tree Canopy Cover Loss), as well as the physical existence of these green spaces in relation to the population living in specific neighborhoods (Tree Cover Per Capita). The Tree Cover Deficit indicator, defined as the amount of tree cover required to reach the minimum target of 15 square meters of tree cover per capita, is used to assess equitable access to tree cover by income group in each city.
Results
The results of the green space indicators suggest that there is an uneven distribution of tree cover throughout the analyzed districts of the 162 UESI cities, with most districts falling into the lower end of the range. An analysis of the Tree Canopy Cover Loss indicator across all the districts reveals a mean district Tree Canopy Cover Loss of 4.2 percent, and a median loss of 0.44 percent. This indicates a heavily skewed distribution, where most districts have a very small proportion of Tree Cover Loss, while a handful of other districts have very high values of Tree Cover Loss. Only 0.05 percent of the districts had lost 100 percent of their tree cover, while around 32 percent of the districts had not experienced any tree cover loss. This distribution can be also seen when the data is aggregated at the city level. Four cities from the UESI had the highest average Tree Canopy Cover Loss of all evaluated cities, at more than 20 percent: Vientiane (28.63 percent), Coimbra (25.8 percent), Fortaleza (25.8 percent), and Bangalore (21.4 percent). The other UESI cities lost less than 20 percent of their tree cover over the last decade, with 52 cities losing less than 1 percent of their tree cover.
The Tree Cover per capita indicator has a very similar distribution, with a mean value of 1,364.8 m2and a median value of 48.52 m2. In fact, about 54.48 percent of all districts within the 162 UESI cities have amounts of tree cover per capita greater than the 15 m2 per capita target, though many cities have at least one neighborhood that has 0 m2of Tree Cover per person. An analysis at the city level provides a complementary perspective: only 34 cities have an average tree cover per capita values below the defined target, with 3 cities – Reykjavík, Nouakchott and Kabul- virtually having no measurable tree cover, followed by Lima as the city with the lowest average tree cover area per capita, 0.12 m2. Fifty-two other UESI cities have tree cover area values below 1m2 per person.
Another way to look at the Tree Cover per capita indicator is through its inverse, Tree Cover Deficit, the average amount of tree cover that citizens in each neighborhood are lacking to reach the 15 m2 per capita target. This analysis provides interesting insights and a different perspective on the distribution of tree cover for the UESI cities mentioned before. The tree cover deficit calculated at the city level shows that most cities have a total amount of tree cover that could provide at least 15 m2 of green space to all its citizens, with only 34 cities having a tree cover deficit. However, if we considered the deficit within each district, only 27 cities have districts that all contain sufficient tree cover to provide 15 m2 to their residents. This difference in results shows the importance of conducting spatial-explicit analyses in order to highlight unequal neighborhood-level distributions within cities that score well on average.
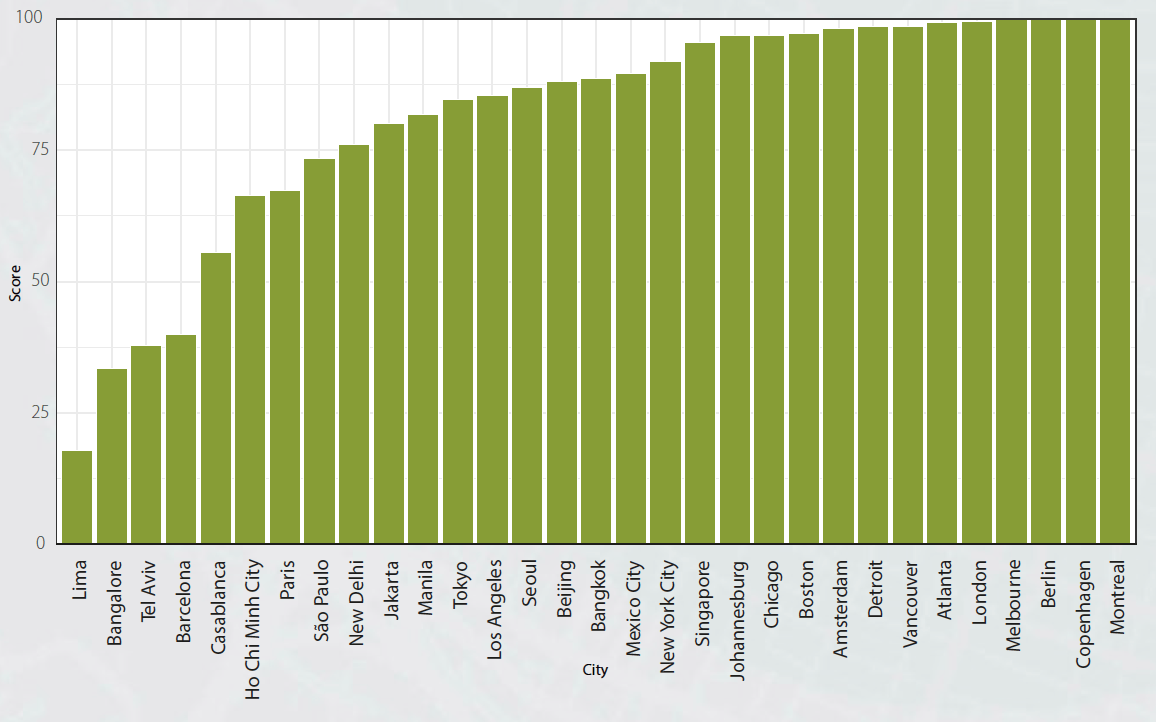
Figure 4. Proximity to Target Scores for Tree Cover per Capita for UESI pilot cities. Higher performing cities are those that are closer or at 100, while lower performing cities are closer to 0.
As with any indicator and dataset, there are some caveats and limitations to be considered. The first and probably most relevant limitation is associated with the 30 x 30 meters per pixel (or 900 m2) spatial resolution of the dataset. This resolution may limit the detection of small green spaces or areas with trees below 5 meters of height, which could be providing some meaningful benefit to citizens. Finer-resolution data are now becoming available and could enable more detailed analyses; for instance, the US Department of Agriculture’s urban forest dataset covers 17 cities across the U.S. at a 3-meter spatial resolution. Similarly, this indicator will not include most streetscape components, such as street trees and linear gardens; while these elements might have a more limited provision of benefits than trees, their impact should not be fully discarded. Box 3 describes how Singapore, for instance, has leveraged linear gardens to add more green space to the city.
Box 3. Highrise Greenery in Singapore.
Singapore has lost 95 percent of its primary forest since 1819, when the British first established a colonial outpost here. In recent years, Singapore has also experienced severe secondary forest losses. As a city-state with fast economic development and population growth, land use changes and deforestation are almost inevitable. In 1967, shortly after its independence, the Singapore government launched the “garden city” campaign, a nationwide movement to promote tree-planting and greening. Since then, the government has actively promoted innovative ways to incorporate more greenery into Singapore’s rapidly evolving urban landscape.
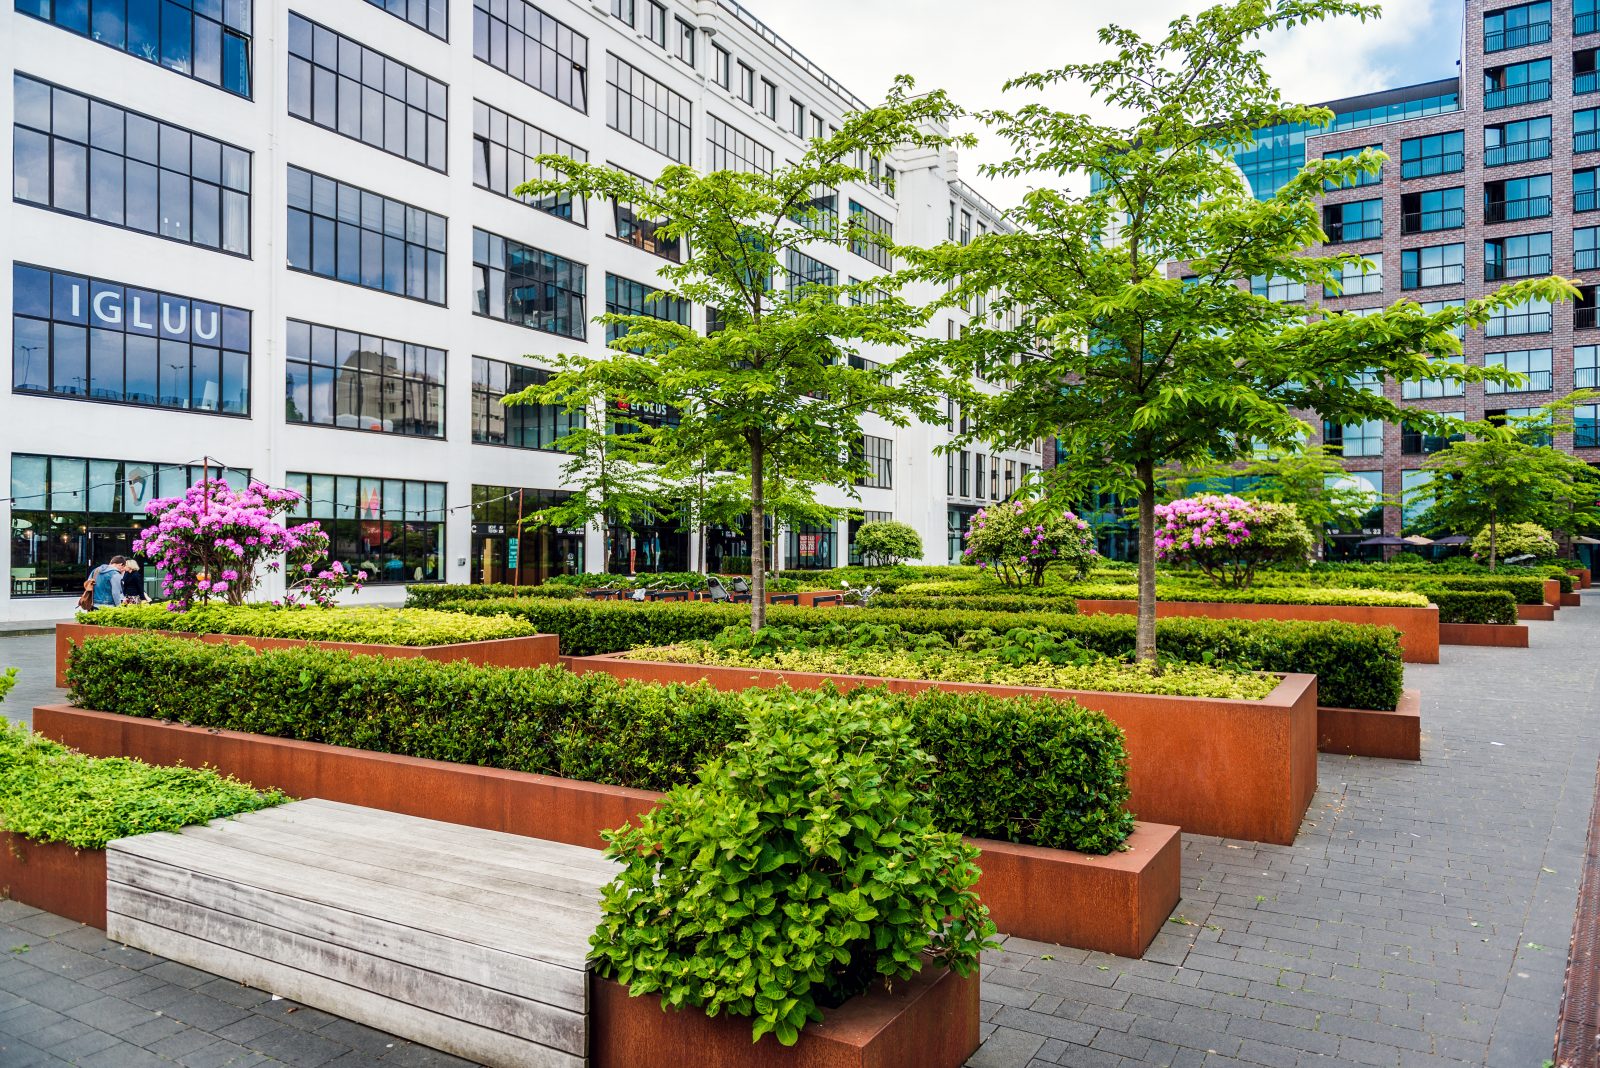
In 2009, the Urban Redevelopment Authority (URA), Singapore’s national urban planning agency, introduced the Landscaping for Urban Spaces and High-Rises (LUSH) program. Through a series of initiatives and regulations, this program encourages planting of accessible greenery in the high-rise urban environment. Noticeably, LUSH’s Landscape Replacement Policy mandates that developers mitigate construction-related losses of green space by incorporating “Landscape Replacement Areas” into their new buildings. These areas refer to a landscaped space on the first or upper levels of the development with its total area equivalent in size to the development site’s footprint. The LUSH programme was then extended in 2014 to cover more geographical areas and development types under LUSH 2.0.
In November 2017, URA updated the LUSH program with its third iteration, injecting more flexibility to the Landscape Replacement Area regulations. Under LUSH 3.0, vertical greenery, extensive green roofs, and rooftop urban farms qualify as Landscape Replacement Areas. New Green Plot Ratio standards are also established to ensure a sufficient density of greenery in private developments.
Box 4. Environmental Inequity at the Neighborhood Level: The Case of Westhaven, Montreal
Montreal (Canada) is blessed with a variety of green spaces — from large urban parks, to green alleyways, local public parks, communal gardens, and street trees. These amenities are essential for addressing certain challenges related to urbanization, including the impacts of heat island and flooding, both of which are becoming more prevalent in the city of Montreal43Ville de Montreal. 2018. Plan Directeur Du Sport Et Du Plein Air Urbain. PDF. Montreal: Ville de Montreal.. However, as highlighted by the UESI and analyzed in the literature,44Conseil Regional de l’Environnement de Montreal. 2007. Le Verdissement Montrealais Pour Lutter Contre Les Ilots De Chaleur Urbains, Le Rechauffement Climatique Et La Pollution Atmospherique green space is not distributed equitably across neighborhoods in the city. Many socio-economically disadvantaged neighborhoods have less access to quality green space in Montreal, suggesting an issue of environmental inequity. However, geospatial maps that compare environmental performance between neighborhoods may overlook inequities in access to green space within neighborhoods.
According to the UESI, Notre-Dame-de-Grace (NDG) is one of the greenest neighborhoods in Montreal, particularly in regards to tree coverage. However, field research, discussions with community organizers, as well as in-depth literature review has brought to attention that green space is not distributed equitably within NDG. As Steve Charters from NDG Community Council states, there are certain “pockets” of disadvantaged areas within the neighborhood that are underserved with respect to green space45Interview with Steve Charters (Coordinator at NDG Community Council). 28 June 2018. This study examines the case of Westhaven, a low-income and socially isolated community within NDG that has disproportionately less greenery than the rest of the neighborhood.
A Socially and Geographically Isolated Community
Right at the western tip of NDG lies an isolated wedge of land, tucked in between a highway and train tracks. Originally designed to house returning soldiers and their families after World War 2, Westhaven quickly became home to immigrants and low-income individuals seeking cheap housing46Interview with Simon Mammone (Community Planner at NDG Community Council). 28 June 2018. Residents normally stay long enough in their apartment to save money, and then upgrade into a new neighborhood — making it challenging to form and sustain close relations with neighbors. What was once a tight-knit, family-oriented neighborhood has become increasingly disconnected47Olsen, Isaac. 2016. “Bruce, Stewart Encourage More Involvement In Westhaven Neighborhood”. NDG News, , 2016..
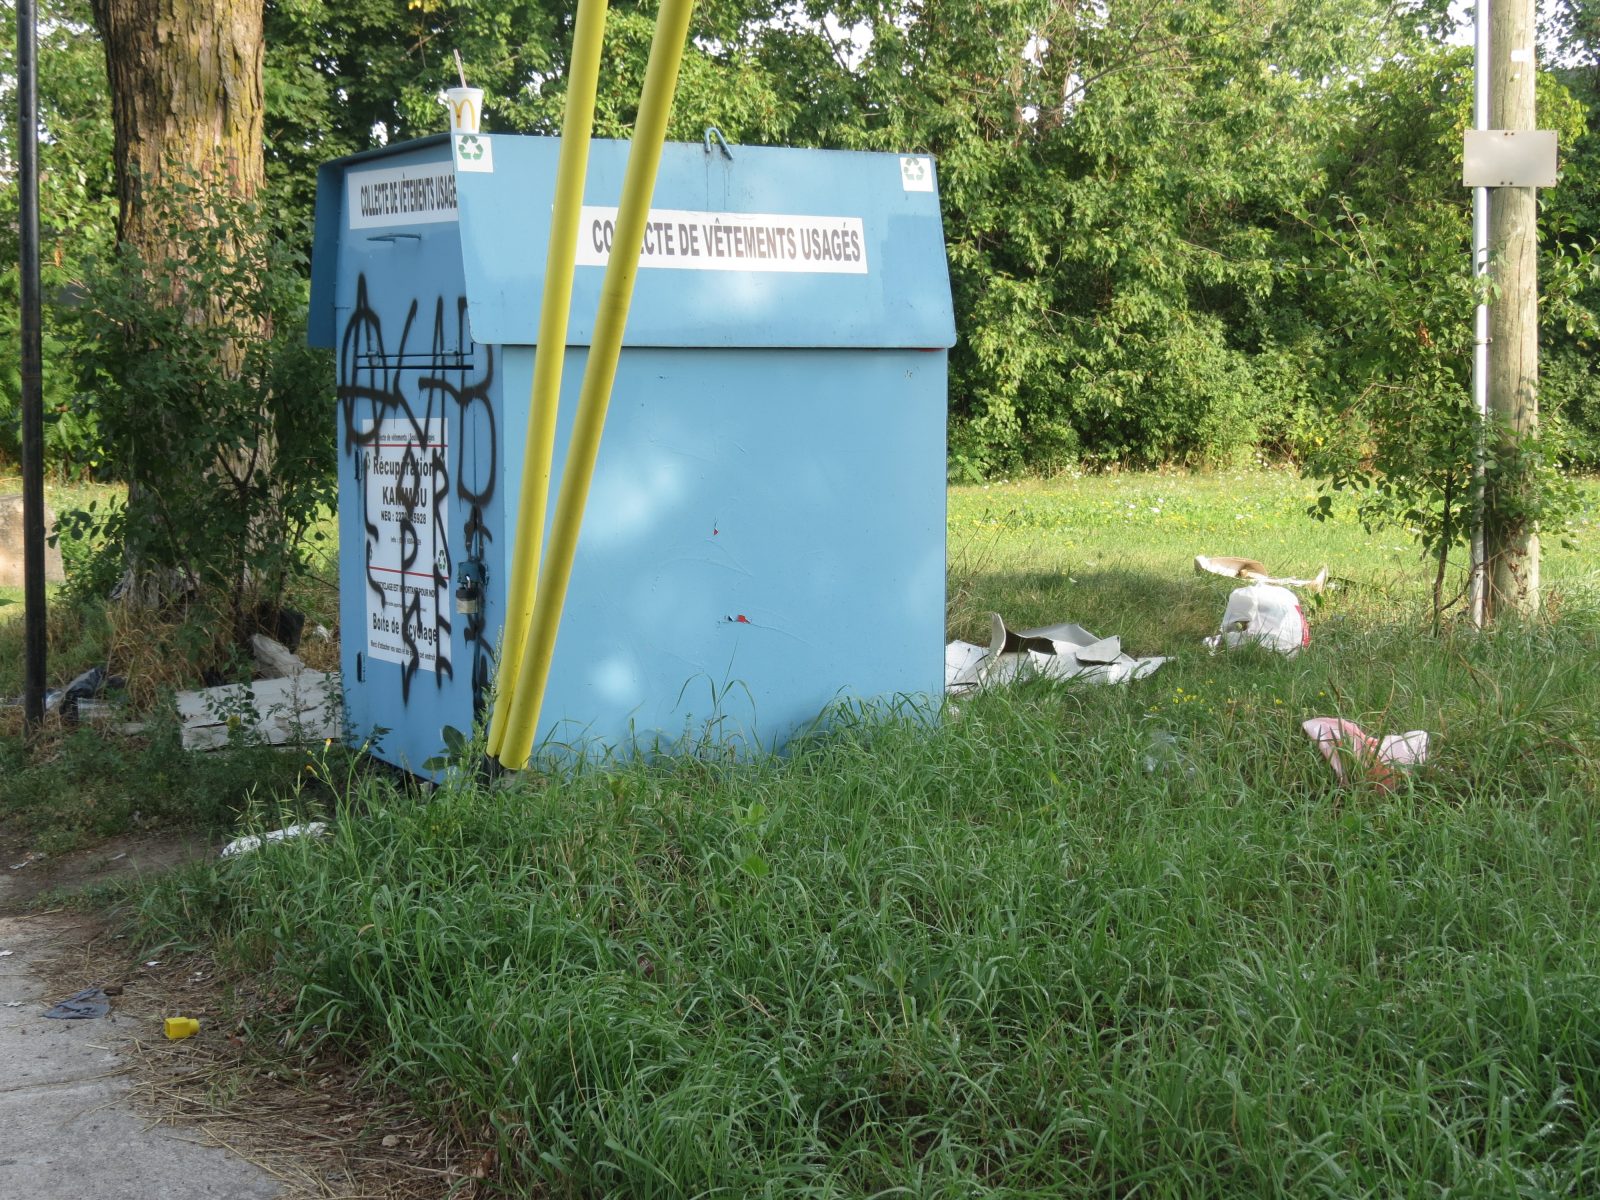
Figure 5. Image of one of the vacant green lots in the Westhaven neighborhood. Photo courtesy of Genevieve Westgate.
A Community Facing Multiple Scales of Inequity
The residents of Westhaven face major challenges in the social, economic and environmental spheres. The share of low-income families is 2.5 percent higher than the average for the Island of Montreal, while the share of unemployed people in Westhaven reaches 16.1 percent, compared to 8.8 percent for the Island48Milusheva, L. 2013. “A Socio-Demographic Analysis Of The Westhaven Neighborhood – Notre-Dame De Grace..”. Residents also face challenges relating to inadequate housing, food insecurity and low access to education. Furthermore, the community has disproportionately less green space than the rest of the neighborhood49Interview with Steve Charters (Coordinator at NDG Community Council). 28 June 2018, with one local park on the other side of a train track (which makes it hard to access) and one green vacant lot that is accumulating garbage and hosting criminal behaviors at night (see Figure 5)50Field observations. The alleys are covered with pavement and absent of vegetation, contributing to a higher level of UHI in the area51Interview with Simon Mammone (Community Planner at NDG Community Council). 28 June 2018. The residents have voiced that they do not have a public green space that they feel meets their needs, either for social or physical activity. Many adolescents expressed that their desires for a basketball court, while some adults wish for a community garden or a dog park52Semi-structured interview with citizens at a community event.
Green Space, Health and Well-Being
Why is having green space important for the community? The literature has widely acknowledged the fact that providing attractive green space may encourage people to spend more time outdoors and facilitate physical activity, even if it is only at a light level53WHO. 2016. Urban Green Space And Health. Copenhagan: WHO Regional Office for Europe.. Increased physical activity has been shown to improve health outcomes, including obesity and cardiovascular health. Furthermore, access to green spaces may have a positive restorative effect on mental health, providing a buffer against stressful life events, reducing anxiety and improving cognitive function54Ibid. Green spaces also provide a place where people can gather, interact and form positive relationships with their neighborhoods, improving community cohesion55Ibid. Given the myriads of challenges that this area is facing, these benefits could be especially beneficial to the residents.
NDG Community Council Project: Planning for a Greener, More Active Community
Recognizing the potential of green space in addressing issues relating to social isolation and community health and well-being, the NDG Community Council launched the Planning for a Greener, More Active Community project. The main objective is to increase green space, improve transit and make the neighborhood more walkable and safe — to improve the overall health of the residents56Interview with Steve Charters (Coordinator at NDG Community Council). 28 June 2018. To achieve their goals in a way that meets the needs of the residents, the council will first and foremost engage with the community, by creating events and going door-to-door to get to know the residents and get their input on the project. Once they have an understanding of the pressing needs of the community, they will relay their observations and analysis to the regional public health office, that, if approved, will give them funding to implement local initiatives. The council explains that the projects will be of a small-scale — such as expanding sidewalks, adding more greenery, creating safe public spaces, and securing the railway crossing — such as to not push these renters out of the neighborhood through the process of “eco-gentrification.” The hope is that by making these micro-changes to the neighborhood, the community will become more active and socially engaged, improving health outcomes and fostering social inclusion and feelings of belonging.
The Way Forward
In sum, despite the fact that NDG has higher green coverage than the Montreal average, there are “pockets” of underserved areas, like Westhaven. This may not be so evident for policy-makers that analyze maps of neighborhood environmental performance. As such, careful attention must be paid when observing the UESI so as to not overlook variations within neighborhoods. It may be useful to use satellite view on the portal to get a better sense of disparities beneath neighborhood rankings. It is essential for policy-makers to understand and visualize these inequities, so they can propose environmental design plans to promote social inclusion and healthy lifestyles, which adequately represents the needs of the population.
Another element that affects the results of the Tree Cover per capita indicator is the population distribution, and the selected boundaries of the analysis. While the analysis aims to analyze the tree cover distribution around urban areas, the physical boundaries and disaggregation have been defined according to the administrative boundaries of the city (see Box 4 for a discussion of intra-neighborhood variation in tree cover). This selection, while necessary in order to combine socioeconomic and environmental datasets, does not distinguished between the strictly urban areas, peri-urban areas, and rural areas located in the periphery or in the middle of the city itself. As a result, some of the districts might incorporate areas with heavy tree cover and very low population density, something that is reflected in some of the very high Tree Cover Per Capita results for some districts, particularly those of significant extent, such as those in Chinese cities.
Tree Cover and Equity
Using the approach detailed in the Equity and Social Inclusion Chapter, we performed an analysis comparing distributional equity of both income and Tree Cover per Capita57It is important to mention that Lima, Casablanca, Bangalore, Delhi, Ho Chi Minh City and Tel Aviv are not considered in this calculation since income information was not available for this cities.. The results of this analysis are exemplified in Figures 5 and 6 for a select number of UESI cities.
Figure 6 provides a graphical representation of Tree Cover per Capita for select UESI cities, based on the construction of Environmental Concentration and Income Lorenz curves. The position of the curves relative to a 45 degree line, which represent a scenario of perfect equity, provides information about the segments of the population in which the environmental outcome – Tree Cover per Capita – is unequally allocated. For example, the position of the Concentration curve below the 45 degree line for cities such as Johannesburg and Singapore, indicates that there is more tree cover per capita allocated to those with more income. To the contrary, the position of the curve above the 45 degree line in cities like Sao Paulo, indicates that there is more tree cover per capita available for with lower income.
For many cities, the concentration curve crosses the 45 degree line of perfect equity. This case suggests that within a city, sectors of the population with different levels of income might experience different relationships with Tree Cover per Capita allocation. For example, in Copenhagen, the Tree Cover per Capita concentration curve presents two pockets of inequity, one located below the equity line, affecting the poorest citizens, and one above below the equity line, benefiting a segment of wealthier citizens. These changes in the relationship between and environmental burden and different sectors of the population can help identify especially vulnerable sectors of the population and help policymakers respond to their particular situations.
A numeric quantification of the inequality in distributions of Tree Cover Deficit and Income, derived from the curves in Figure 6, is summarized in Figure 7. The quadrant plot presents the UESI’s proposed typology that categorizes the relation between the environmental inequality and income inequality, using the Environmental Concentration Index (ECI) and the Gini Coefficients respectively (see the Equity and Social Inclusion Profile for a more detailed description of this plot). The results indicate cities are spread through different levels of income inequality, as indicated by the Gini coefficient, and that environmental inequality is also prevalent across most UESI cities.
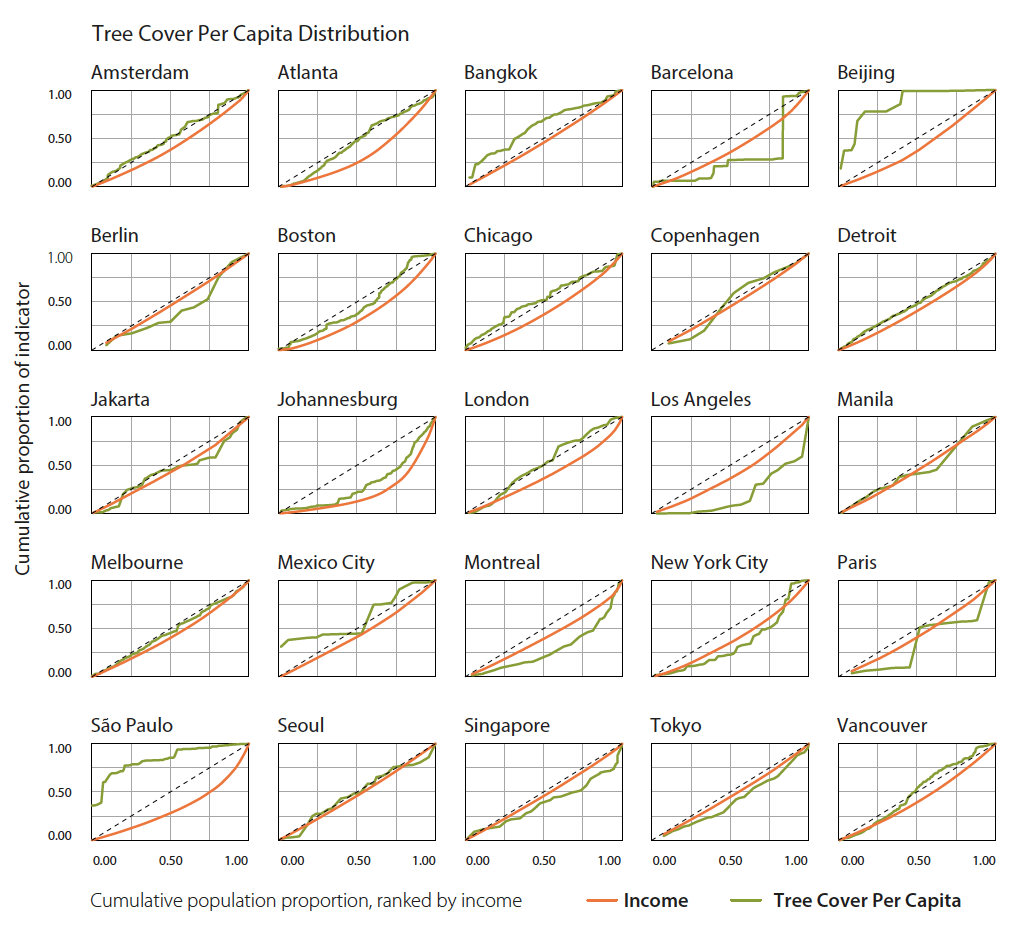
Figure 6: Environmental and income distribution curves for selected UESI cities. These plots show the distributions of Tree Cover per Capita (e.g., the concentration curve in blue) and income (e.g., the Lorenz curve in red) throughout city neighborhoods. Deviations from the dotted line (e.g., the line of perfect equity) illustrate cities that are less equitable in their distribution of Tree Cover per Capita. Concentration curves above the line of equity indicate the environmental burden is more heavily allocated to those with less income; concentration curves below the line of equity indicate that the environmental burden is more heavily allocated to those with greater income. (See the Equity and Social Inclusion Profile for a more detailed description of this plot and the Cities Page for a full exploration all cities’ environmental and income distribution curves).
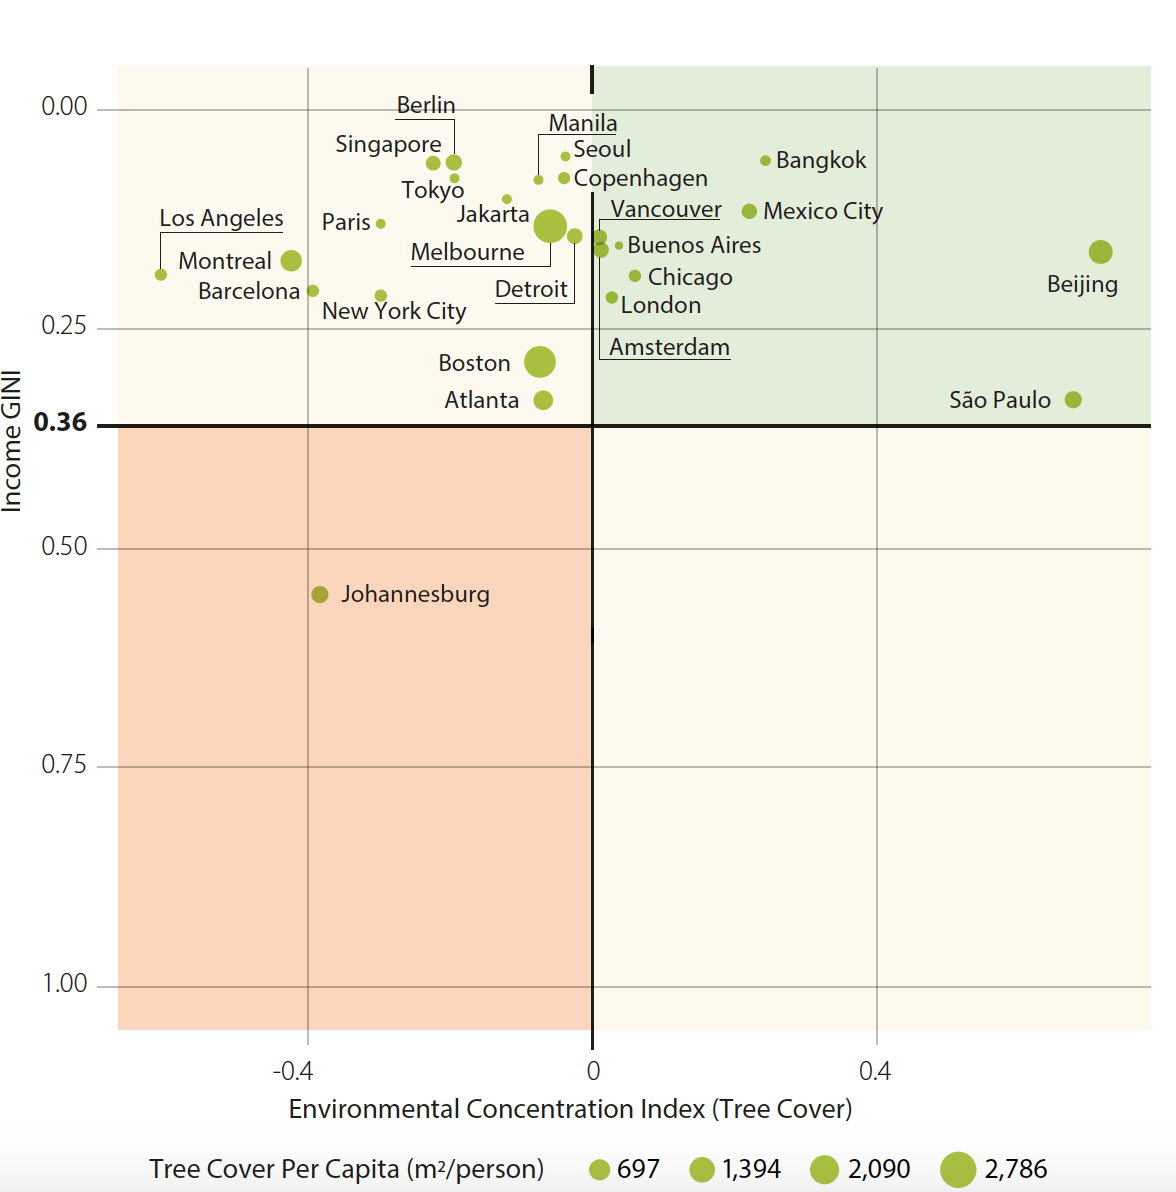
Figure 7. Tree Cover per Capita Equity typology plot. The plot considers the Income Gini and Tree Cover Per Capita Environmental Concentration Index to define four quadrants. The Income Gini Values represent the distribution of wealth across the population and range from 0 to 1. A Gini value of zero indicates a perfectly equal distribution of income across the population, while a high Gini value (out of a maximum of 1) suggests a highly unequal distribution of wealth. The Environmental Concentration Index (ECI) measures the variation of Tree Cover per Capita in response to income. Positive ECI values indicate that the environmental benefit is allocated on the poorest citizens, while a negative ECI indicates that the environmental benefit is allocated on the wealthier citizens. The size of the dots represents the extent of a city’s Tree Cover per Capita (in square meters/person). (See the Equity and Social Inclusion Profile for a more detailed description of this plot).
The top left quadrant (Low Gini and positive ECI) includes cities such as Albuquerque, Los Angeles, Brussels, Hamburg, and Seoul, where the Tree Cover per Capita is more heavily allocated to the richest income earners in those cities. While these cities have low income inequality, the environmental pressure falls hardest on low-income populations — who are negated the benefits of access to green space at the same level as other citizens — potentially creating an additional economic pressure on the lowest-earners of the city and increasing the gap between poorer and richer citizens. The top right quadrant (low Gini and negative CI) includes cities such as Malaga, London, and Sao Paulo, where the Tree Cover per Capita is more heavily allocated to the lowest-income earners of city. In these cities, the inequality of the Tree Cover per Capita does not actively aggravate the relatively low income inequality throughout the city, because the poorer citizens don’t need to spend economic resources to gain access to tree cover or green spaces.
Cities in the bottom right quadrant, such as Panama City, Istambul, or Kyiv are those were the tree cover is more heavily allocated to the lowest-income earners of the city, thus potentially allowing easier access to this green spaces, but have high levels of income inequality which creates economic pressure. Finally, the cities in the lower left quadrant (high Gini and negative ECI), such as Johannesburg, Lima or Caracas, have both high income inequality and high environmental inequality. In other words, the unequal allocation of tree cover could compound the city’s income inequality, exacerbating the situation of the lowest income-earners and increasing the gap between poorer and richer citizens.
Finally, it is worth mentioning that while the ECI and Gini values are relevant summary indices to evaluate inequality in the distribution of an environmental outcome, there are some limitations to be considered (see the Equity and Social Inclusion Profile for a more details). The interpretation of the ECI needs to be complemented with an analysis of the Environmental Concentration curves themselves and the data used for their construction. This process will allow the decisionmakers to have a more comprehensive picture of the specifics of their cities, both in terms of the allocation and the intensity of the environmental outcomes, as well as its relation with income to craft potential useful interventions to address these issues.