
We have updated the Urban and Environment Social Inclusion Index (UESI), the first and only spatially-explicit index measuring cities’ environmental performance, equity, and progress towards Sustainable Development Goal 11, which charges urban areas to be sustainable and inclusive.
The UESI includes 283 cities from 95 countries, representing about 10% of the global population and 18% of the 4.4 billion city dwellers worldwide, according to the World Bank.
The UESI has continued to expand and evolve from its original 32 cities, and in 2023 includes 118 new cities, with a focus on increasing the number of cities in the Global South. In our update, we added a significant number of cities in Europe, South America, and Asia. Now, 28% of UESI cities are located in Asia and 10% are located in both Africa and Latin America (see Figure 1).
Based on the latest results of the UESI, we find that cities throughout the world continue to face challenges in providing positive and inclusive environmental outcomes to their citizens in issues like air pollution, heat exposure, access to tree cover, and transportation. These results are used to inform policymakers about cities’ progress toward science-based indicators of equity and environmental performance.
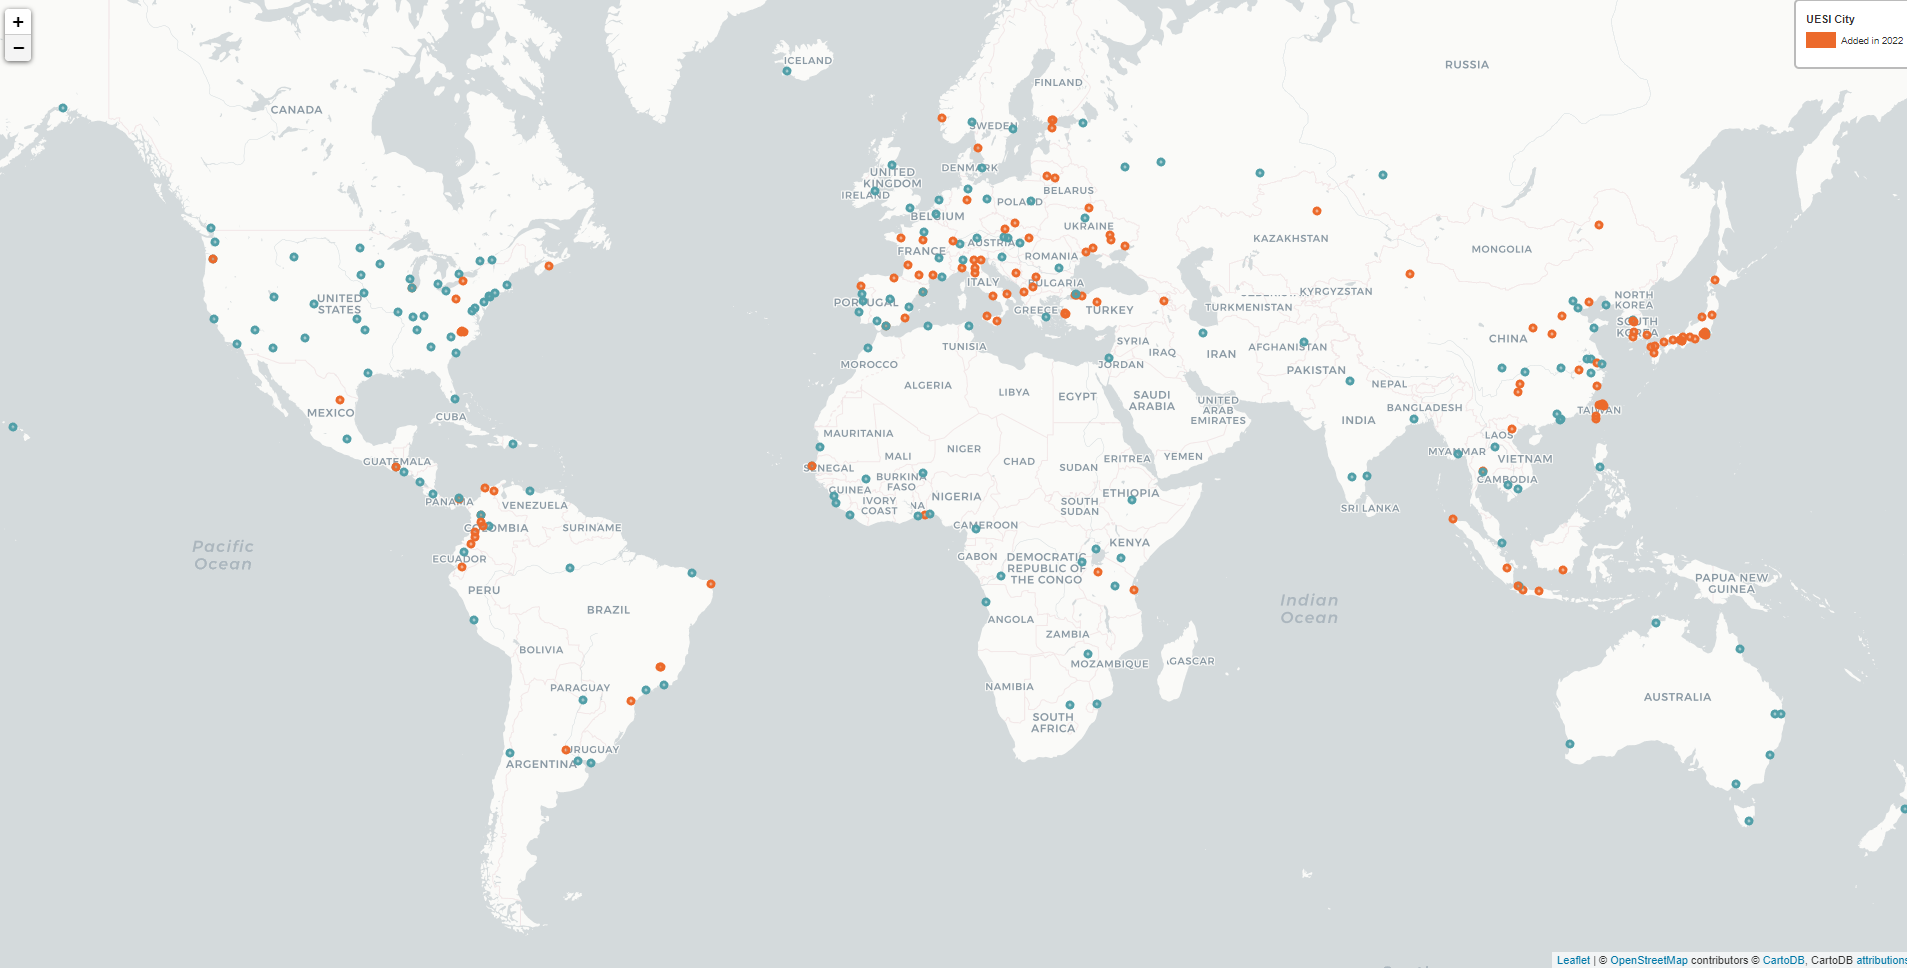 Figure 1. Map of cities added to the UESI.
Our update also includes changes to our key findings and methods pages, as well as new content and edits to some of the issue profiles, such as a new Box in the Transportation profile describing challenges in using OpenStreetMap to evaluate public transit access.
Methodological updates for better evaluating performance
Our research methods have been updated to improve our analysis and comparison of urban environmental performance across global cities. To accomplish this task, we implemented new methods for better identifying and distinguishing non-urban neighborhoods from urban neighborhoods through a clustering approach that utilizes features that help define an urban area: population density, built-up extent, and land cover.
The UESI is primarily concerned with measuring environmental performance and equity in urban areas, not predominantly rural neighborhoods in the outer fringe of urban centers that may still be included in a city’s administrative boundary. We updated our methodology accordingly to filter out non-urban neighborhoods to ensure our evaluation accurately reflects urban environmental performance.
New Key Findings released
We have updated the Key Findings page with 9 major takeaways from our most recent analysis of all 283 cities.
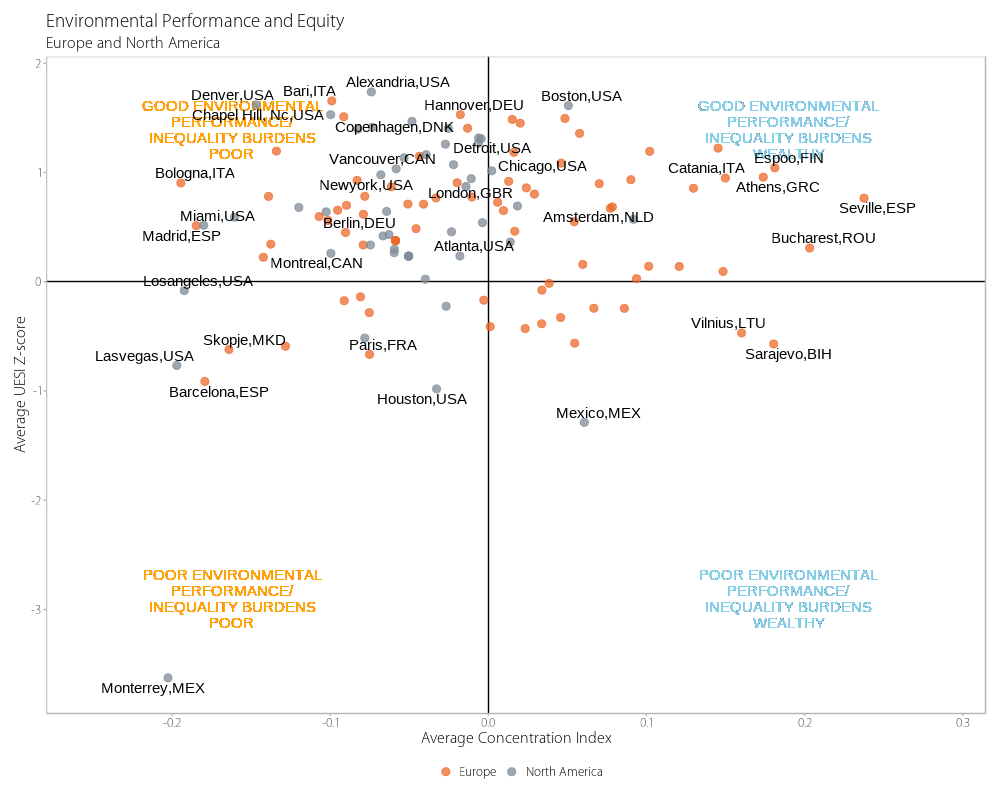
With the inclusion of more cities, our analysis shows that cities in the Global North generally perform better than cities in the Global South. More than half of European and North American cities perform above average, whereas 67 of 87 cities in Asia perform below average (see Figures 2a and 2b).
 |
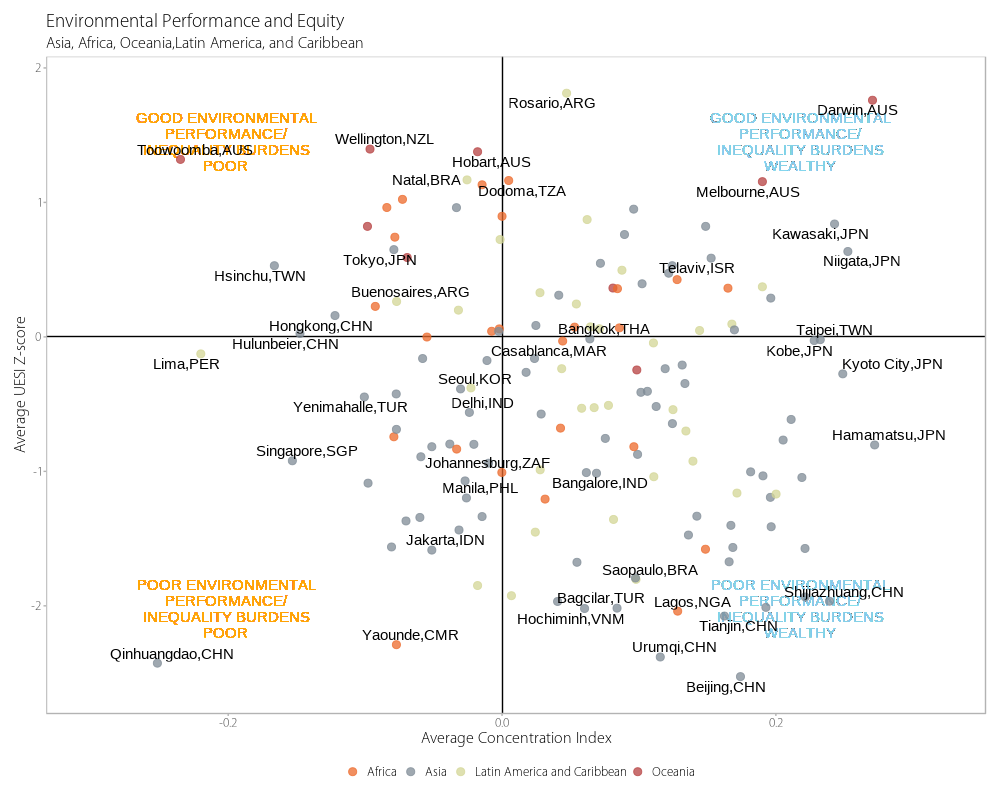 |
Figure 2. Environmental performance and equity of a) North American and European cities and b) African, Asian, Latin American, and Oceanic cities.
Our updated key findings also indicate there is room for improvement in at least one indicator category for all cities included in the UESI. A staggering 91% of people in UESI cities breathe air whose pollution exceeds the science-based threshold set by the World Health Organization and half of UESI cities do not have public transportation within walking distance.
Additionally, our findings also indicate that while many cities show positive environmental performance, nearly half of the UESI cities (48%) are failing to equitably distribute their environmental outcomes, disproportionately burdening less affluent citizens with poor air quality, exposure to urban heat, and lack of access to tree cover and public transport.
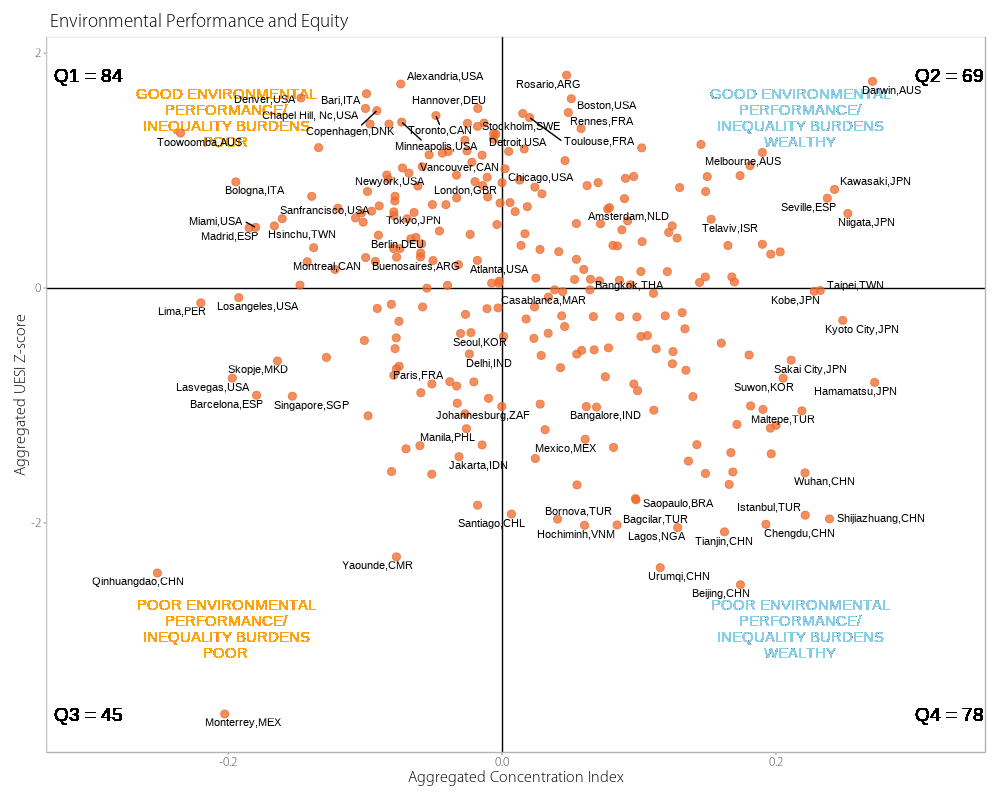
Figure 3. A four-quadrant plot examining the relationship between environmental performance (in terms of average z-score, indicating the distance from the mean for a city’s performance on the UESI indicators) and equity (in terms of average concentration index, see the Equity and Social Inclusion issue profile for more details).
UESI Update Recap
As urbanization continues, it’s important to consider how the growth of urban areas and migration toward cities impacts the environment and the quality of life for city dwellers.
The UESI provides clarity to policymakers and other stakeholders about the status of urban environmental performance and equity on a global scale and an open data portal to explore the spatially explicit results for each city. With the addition of these new cities, and therefore a more representative analysis, we hope that our findings can inform current and future development on how to be more inclusive and sustainable.
We will continue updating the UESI results throughout the year, updating the socioeconomic information for cities in the UESI, potential new indicators for climate policy and climate change, as well as trend analyses to evaluate the changes in environmental performance and equity distribution from the first version of the UESI (2019) to the most recent data.
Recent Comments