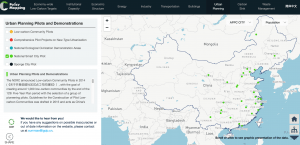
The iGDP Policy Mapping Tool displays the number of cities and regions piloting National Smart City strategies.
Low-carbon development initiatives are proliferating in Chinese cities in line with the country’s National New-type of Urbanization Plan (2014-2020), yet there are major uncertainties regarding explicit targets, implementation strategies, and progress tracking.
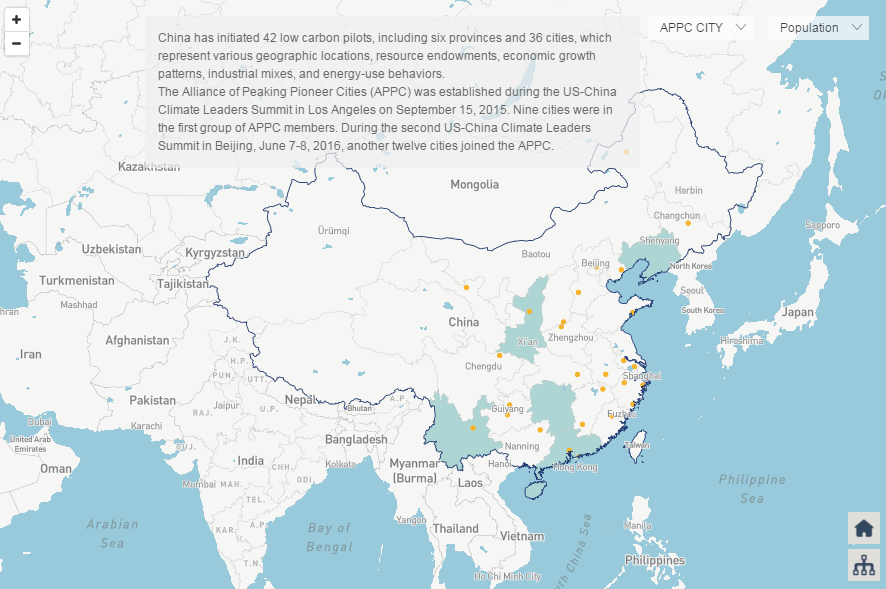
The Chinese government has set an ambitious international commitment of reducing carbon intensity by 40% to 45% from 2005 to 2020. The National New-type of Urbanization Plan (2014-2020), released in April 2014, highlights the contributions cities can make. Many Chinese cities have announced low-carbon development visions, goals, and pilot projects. For instance, through The China Alliance of Peaking Pioneer Cities (APPC), announced on September 15, 2015 at the US-China Climate Leaders Summit in Los Angeles, 23 cities committed to peak their carbon emissions by 2030.
There are discrepancies, however, between the grand vision for urban low-carbon development, and the actions on the ground. In large part, this stems from an inadequate understanding as to what constitutes low-carbon urbanization. These knowledge gaps make target setting difficult. Compounding the challenges to action, most cities lack enforcement mechanisms and monitoring, reporting, and verification (MRV) protocols.
The iGDP Policy Mapping Tool
An image of the iGDP Policy Mapping Tool’s coverage of cities and regions piloting low-carbon development strategies.
An online policy mapping tool, recently developed by the Innovative Green Development Program (iGDP), may help address this gap in data collection, reporting and verification. The iGDP Policy Mapping Tool is an online database and interactive platform that collects and depicts the current status of urban low-carbon policies and actions in China’s cities and regions. The mapping tool can be used for tracking and reporting progress, as it regularly issues a series of Policy Progress Factsheets and Regional Low Carbon Development Performance Reports.
The tool will be useful for city and national officials, urban planners, and energy and environmental specialists who wish to track and influence green urban development in China. Built on research of 50 case studies and 300 policies, the tool promotes knowledge sharing among the Chinese cities piloting low-carbon development strategies. By using the Policy Mapping platform, policy makers can identify new best practices in low-carbon development.
Coverage and indicators
An interactive map of the indicators covered by the iGDP Policy Mapping Tool.
The iGDP Policy Mapping Tool focuses on 42 governments piloting low carbon development. These six provinces and 36 cities represent a mix of geographic locations, resource endowments, economic growth patterns, industrial compositions, and energy-use behaviors. Most of the cities included in the tool are members of the APPC.
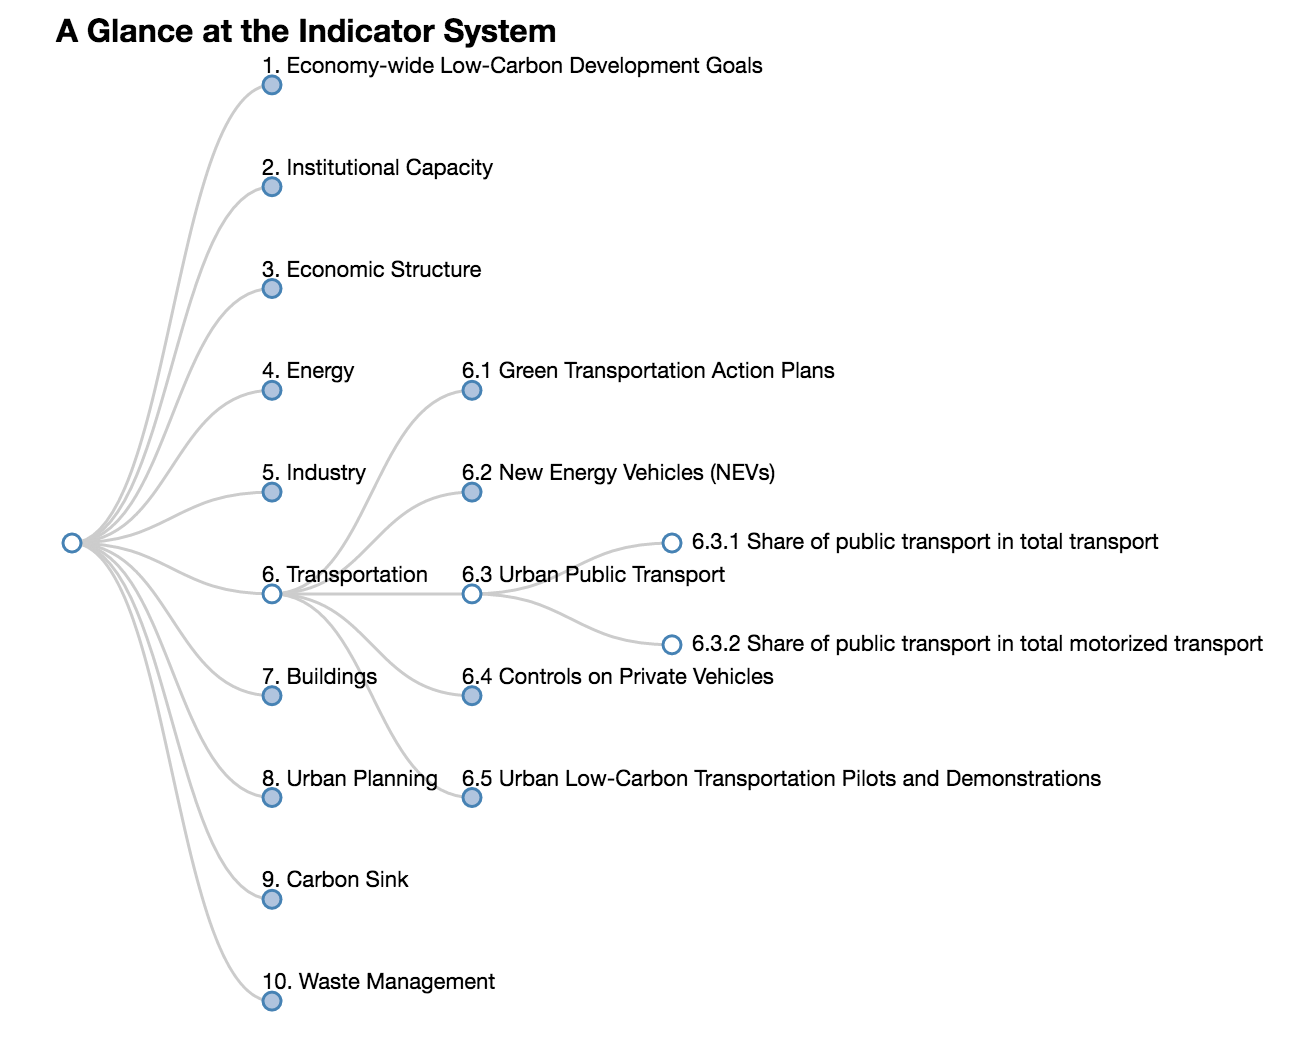
The iGDP Policy Mapping tool uses more than 91 indicators spanning sectors including energy, industry, transportation, buildings, carbon sinks, and waste management, to describe policies, achieved performance and future plans. The selection of these sectors and indicators reflects the ten key principles of low-carbon urbanization for Chinese cities, recommended by 19 non-profit organizations in December 2015.
The ten principles fall into three categories: Low-Carbon Urban Form, Resource Efficiency, and Inclusive Urban Governance. Rather than repeat widely known ideals of sustainable urban development, these principles specifically address the most pervasive environmental weak points observed in Chinese cities. These recommended principles are also essential features of a truly low-carbon city. The tool also incorporates 18 indicators that describe cities’ economy-wide low-carbon targets, institutional capacity, and economic structure.
How does this tool compare with similar urban carbon development platforms?
The iGDP Policy Mapping Tool focuses on supporting the monitoring and evaluation of different low-carbon policies and actions. Its focus complements other tools that focus on different elements of the policy design and implementation process. For instance, the tool does not provide recommendations on how to prioritize different sectors or policies, which is the major difference separating it with other policy tools that inform governments’ decision-making processes.
The Benchmarking and Energy Saving Tool for Low Carbon Cities (BEST Cities), for example, focuses on identifying sources of energy and carbon emission savings, along with strategies to harness these reductions. The Eco and Low-carbon Indicator Tool for Evaluating Cities (ELITE Cities) has a broader scope that includes air, water, and land use. These tools help cities benchmark and evaluate performance, track progress, and provide practical and scientific prescriptions.
Functions, features and future improvements
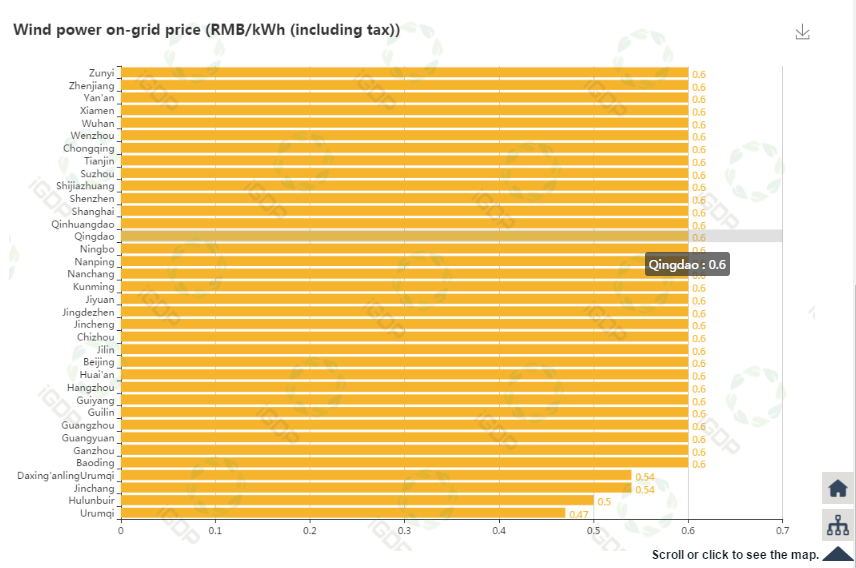
A graph from the iGDP Policy Mapping Tool, comparing the wind power on-grid prices across Chinese cities and regions.
Allowing users to export visualizations and reports, including benchmarking graphs, priority policies, and policy details, could make it easier for users to draw on the tool’s insights. Appropriate, periodic updates, like the expansion or revision of indicators, will also be essential for maintaining the platform’s ability to monitor cities’ progress and reporting. The tool could be further improved by providing additional features that allow researchers to explore issues in greater detail, such as the ability to review the outcomes of two or more indicators across different sectors.
In sum, however, the iGDP Policy Mapping Tool provides important insight into the strategies and progress of cities and regions pioneering ambitious low-carbon development strategies. Making this data accessible will help build a concrete understanding of what low-carbon urbanization looks like, and how it can be measured and strengthened.
Featured image: The iGDP Policy Mapping Tool displays the number of cities and regions piloting National Smart City strategies.
Recent Comments